QQuestionAnatomy and Physiology
QuestionAnatomy and Physiology
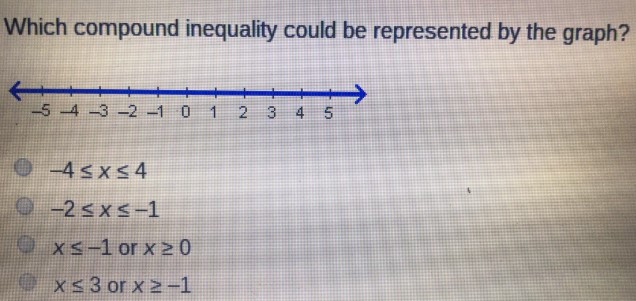
Which compound inequality could be represented by the graph?
\begin{aligned}
& - 5 - 4 - 3 - 2 - 1012345 \\
& - 4 \leq x \leq 4 \\
& - 2 \leq x \leq- 1 \\
& x \leq- 1 \text { or } x \geq 0 \\
& x \leq 3 \text { or } x \geq- 1
\end{aligned}
Attachments
6 months agoReport content
Answer
Full Solution Locked
Sign in to view the complete step-by-step solution and unlock all study resources.
Step 1Let's solve this step by step:
Step 2: Analyze the graph
- This means the solution involves the interval $$-2 \leq x \leq -1
- The graph shows a shaded region between - 2 and - 1 on the number line
Final Answer
- 2 \leq x \leq - 1
Need Help with Homework?
Stuck on a difficult problem? We've got you covered:
- Post your question or upload an image
- Get instant step-by-step solutions
- Learn from our AI and community of students