Hypothesis Testing And Analysis Of Aggression Intervention Data
Explore hypothesis testing in the context of aggression intervention data in this Assignment Solution.
Amelia Davis
Contributor
4.6
30
7 months ago
Preview (2 of 2 Pages)
100%
Purchase to unlock
Page 1
Loading page ...
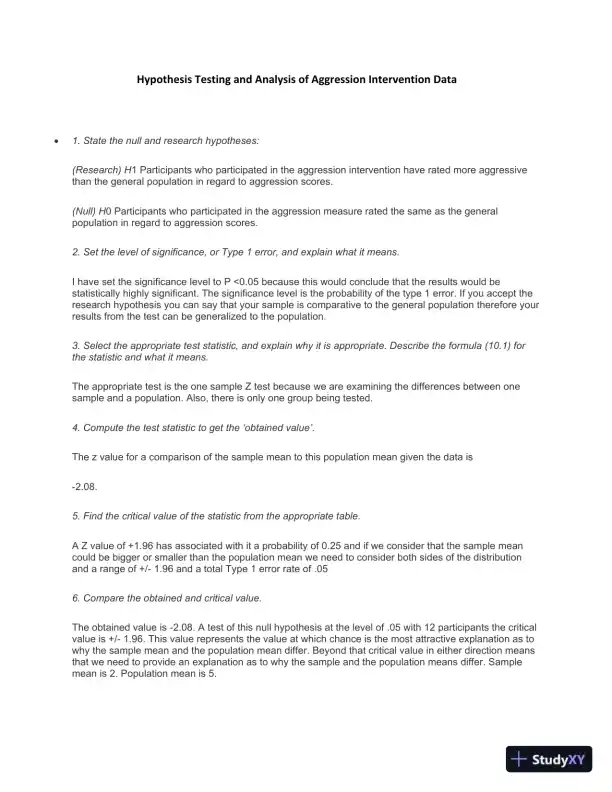
Hypothesis Testing and Analysis of Aggression Intervention Data•1. State the null and research hypotheses:(Research) H1 Participants who participated in the aggression intervention have rated more aggressivethan the general population in regard toaggression scores.(Null) H0 Participants who participated in the aggression measure rated the same as the generalpopulation in regard to aggression scores.2. Set the level of significance, or Type 1 error, and explain what it means.I have set the significance level to P <0.05 because this would conclude that the results would bestatistically highly significant. The significance level is the probability of the type 1 error. If you accept theresearch hypothesis you can say that your sample is comparative to the general population therefore yourresults from the test can be generalized to the population.3. Select the appropriate test statistic, and explain why it is appropriate. Describe the formula (10.1) forthe statistic and what it means.The appropriate test is the one sample Z test because we are examining the differences between onesample and a population. Also, there is only one group being tested.4. Compute the test statistic to get the ‘obtained value’.The z value for a comparison of the sample mean to this population mean given the data is-2.08.5. Find the critical value of the statistic from the appropriate table.A Z value of +1.96 has associated with it a probability of 0.25 and if we consider that the sample meancould be bigger or smaller than the population mean we need to consider both sides of the distributionand a range of +/-1.96 and a total Type 1 error rate of .056. Compare the obtained and critical value.The obtained value is-2.08. A test of this null hypothesis at the level of .05 with 12 participants the criticalvalue is +/-1.96. This value represents the value at which chance is the most attractive explanation as towhy the sample mean and the population mean differ. Beyond that critical value in either direction meansthat we need to provide an explanation as to why the sample and the population means differ. Samplemean is 2. Population mean is 5.