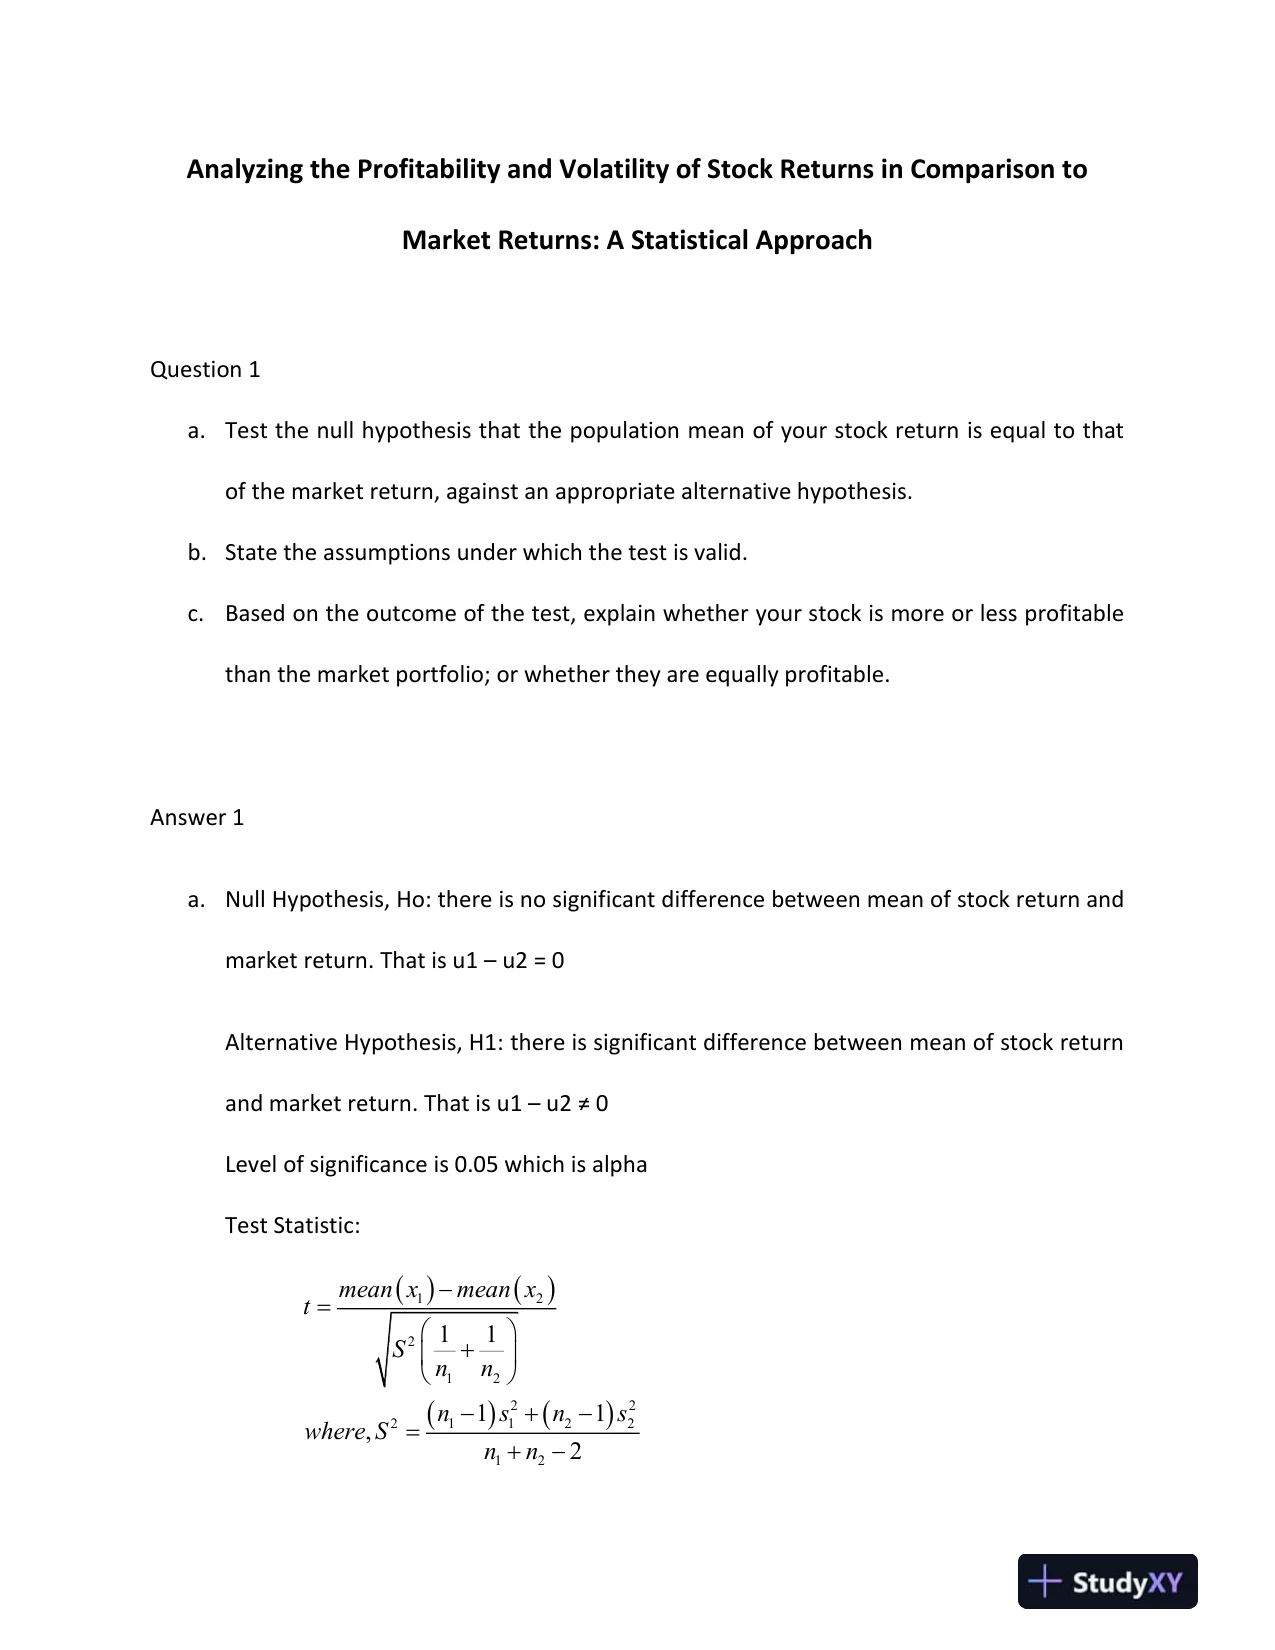
 Analyzing the Profitability and Volatility of Stock Returns in Comparison toMarket Returns: A Statistical ApproachQuestion 1a.Test the null hypothesis that the population mean of your stock return is equal to thatof the market return, against an appropriate alternative hypothesis.b.State the assumptions under which the test is valid.c.Based on the outcome of the test, explain whether your stock is more or less profitablethan the market portfolio; or whether they are equally profitable.Answer 1a.Null Hypothesis, Ho: there is no significant difference between mean of stock return andmarket return.That is u1–u2 = 0Alternative Hypothesis, H1: there is significant difference between mean of stock returnand market return.That is u1–u2 ≠ 0Level of significance is 0.05 which is alphaTest Statistic:()()()()122122211222121111,2mean xmean xtSnnnsnswhere Snn−=+−+−=+−
Preview Mode
This document has 11 pages. Sign in to access the full document!