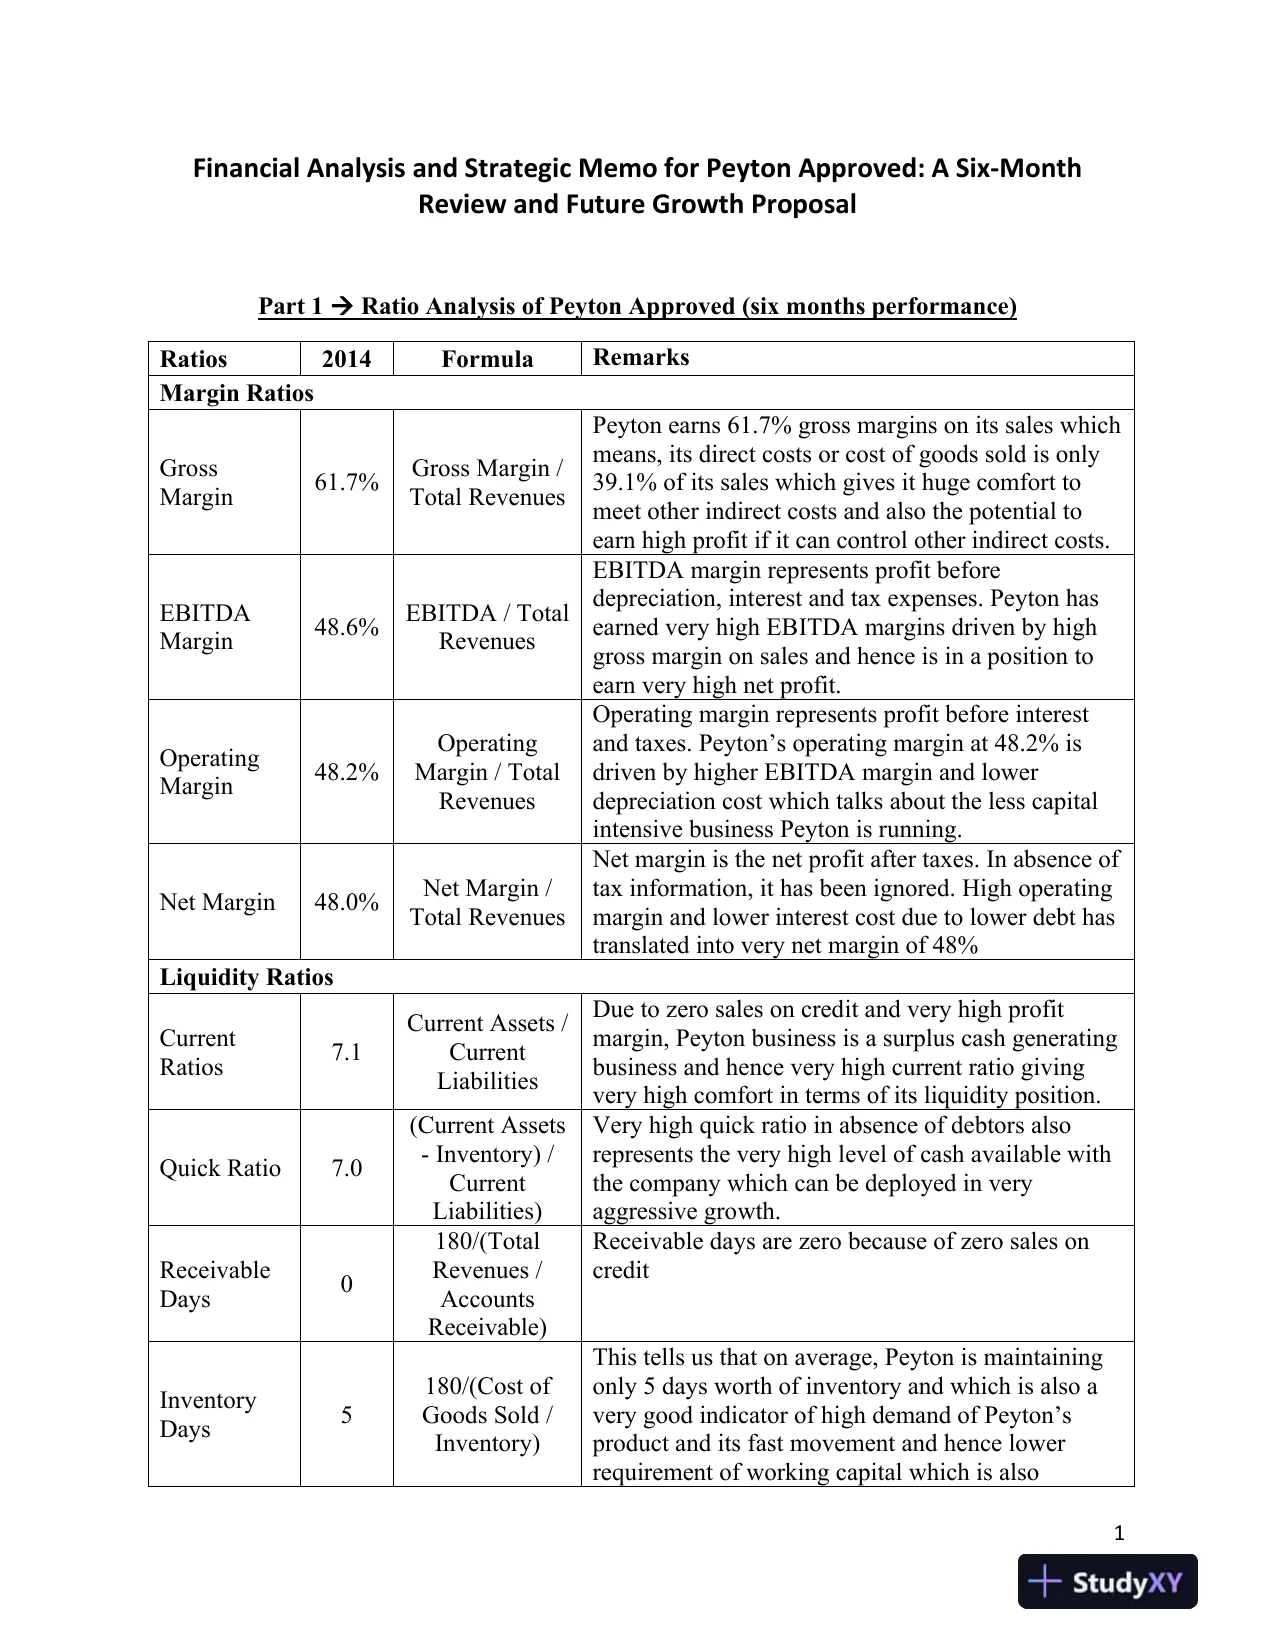
 1Financial Analysis and Strategic Memo for Peyton Approved: A Six-MonthReview and Future Growth ProposalPart 1Ratio Analysis of Peyton Approved(six months performance)Ratios2014FormulaRemarksMargin RatiosGrossMargin61.7%Gross Margin /Total RevenuesPeyton earns 61.7% gross margins on its sales whichmeans, its direct costs or cost of goods sold is only39.1% of its sales which gives it huge comfort tomeet other indirect costs and also the potential toearn high profit if it can control other indirect costs.EBITDAMargin48.6%EBITDA / TotalRevenuesEBITDA margin represents profit beforedepreciation, interest and tax expenses. Peyton hasearned very high EBITDA margins driven by highgross margin on sales and hence is in aposition toearn very high net profit.OperatingMargin48.2%OperatingMargin / TotalRevenuesOperating margin represents profit before interestand taxes. Peyton’s operating margin at 48.2% isdriven by higher EBITDA margin and lowerdepreciation cost which talks about the less capitalintensive business Peyton is running.Net Margin48.0%Net Margin /Total RevenuesNet margin is the net profit after taxes. In absence oftax information, it has been ignored. High operatingmargin and lower interest cost due to lower debt hastranslated into very net margin of 48%Liquidity RatiosCurrentRatios7.1Current Assets /CurrentLiabilitiesDue to zero sales on credit and very high profitmargin, Peyton business is a surplus cash generatingbusiness and hence veryhighcurrent ratio givingvery high comfort in terms of its liquidity position.Quick Ratio7.0(Current Assets-Inventory) /CurrentLiabilities)Very high quick ratio in absence of debtors alsorepresents the very high level of cash available withthe company which can be deployed in veryaggressive growth.ReceivableDays0180/(TotalRevenues /AccountsReceivable)Receivable days are zero because of zero sales oncreditInventoryDays5180/(Cost ofGoods Sold /Inventory)This tells us that on average, Peyton is maintainingonly5days worthof inventory and which is also avery good indicator of high demand of Peyton’sproduct and its fast movement and hence lowerrequirement of working capital which is also
Preview Mode
This document has 11 pages. Sign in to access the full document!