

Operations And Supply Chain Management For The 21st Century, 1st Edition Solution Manual
- Operations Management
- 225 pages
- Shared May 2025
Stay on top of your textbook work with Operations And Supply Chain Management For The 21st Century, 1st Edition Solution Manual, a guide offering complete solutions for every exercise.
Preview 16 of 225 pages
See the first 16 pages exactly as they appear in the document.
Page 1 Read page 1 as text
Solutions Manual Operations & Supply Chain Management for the 21st Century First Edition
Page 2 Page 3 Read page 3 as text
Chapter 1: Operations and Supply Chain Strategy End of Chapter Questions 1. Examples of structural and infrastructural decisions a Days Inn would need to make. Structural Decisions: Capacity: This deals with how many rooms to have in each hotel, the relative size of each room, and how closely to try to match capacity to demand. In general, a Days Inn is likely to try to keep much less capacity cushion than a Four Seasons since the cost of not serving a customer (i.e. having no rooms left) is much less than at a Four Seasons. Facilities: The Days Inn needs to design each hotel to include a mix of rooms and public facilities (i.e. the lobby, breakfast area, gift shop etc.). A lower cost hotel like a Days Inn is much more likely to have very limited and very functional public spaces. In contrast, the Four Seasons will have very generous, expensively furnished lobby space and areas such as a restaurant (usually more than one), a gift/apparel shop and perhaps a spa. In all cases the Days Inn will either not have the same type of facility or will have a much more utilitarian version. Infrastructural Decisions: Workforce: This is one of the biggest differences between a Days Inn and a Four Seasons. The Days Inn will hire relatively few, general purpose workers. Usually one person will man the front desk and be responsible for checking customers in/out, answering the phone, giving directions to customers and fixing any problems. Often customers will have to wait when the desk clerk is busy. In comparison, the Four Seasons will have multiple people at the front desk and more excess capacity. There will be a dedicated concierge to answer questions about where to eat dinner, see shows, sightsee, etc. The Four Seasons will employ many more specialists, but these people will be less utilized on average so that there is more cushion. Quality Systems: While both hotels care about quality, the approaches used will differ substantially. Days Inn will be concerned primarily with conformance quality. The quality system will be designed to periodically assess key measures but will not include high cost recovery mechanisms. In comparison, Four Seasons will take extra steps. For example, most high quality hotels employ an engineer or maintenance chief who is on call 24 hours a day. If there is a major problem such as a broken toilet in a customer’s room, the hotel will get that fixed within an hour. In contrast, the Days Inn might just move the customer to another room and not rent the room with the broken toilet until a plumber can get there during normal business hours. This approach is lower cost but substantially less convenient for customers.
Page 4 Read page 4 as text
2. Examples of structural and infrastructural decisions that a manufacturer of low cost computers would make. Structural Decisions: Facilities: These are likely to be in low-cost, developing countries such as China or Mexico. The cost savings is traded off against a longer lead time to deliver computers to different countries. Dell builds its manufacturing plants in the markets it plans to sell computers in since it wants to be close to customers in order to minimize delivery lead time. Vertical Integration: Typically the low cost manufacturer will seek to find the lowest cost supplier regardless of location and will change fairly often if a lower price is found. Dell typically will maintain a longer relationship with most suppliers and will highly value the reliability of delivery time instead of simply looking at the cost of parts. Infrastructural Decisions: Production Planning/Scheduling: This is one of the biggest differences. The low cost manufacturer operates a push system where it will plan large quantities of each computer model well in advance to a forecast. These computers will be manufactured and sent to a distribution center or retailer for sale. When the forecast is too high, the manufacturer will have to sell computers at a discount to get rid of models that are old or obsolete. When the forecast is too low, sales will be hurt because customers will be unable to get what they want. In contrast, Dell builds computers to order. It still needs to forecast the number of components (i.e. hard drives, RAM chips, CDs etc.) but it waits to get firm customer orders before assembling each computer. Dell uses quite a bit of yield or revenue management to encourage customers to change their orders. For example, it Dell is running low on 320 GB hard drives, it might offer an online discount where a customer can get a 500 GB hard drive for the same price. Dell Competitive Priorities: While price and cost is certainly important to Dell, the ability to offer flexibility is probably more important. After all, Dell allows you to design the computer you want. Delivery is important, but the goal is not necessarily to be ultra-fast but instead to be reliable. A customer must already be willing to wait 3-5 days to get their computer as opposed to going to a store like Best Buy and getting one immediately. The important thing for Dell is getting the computer to the customer within a “reasonable” time frame – if the 3-5 day quote for delivery slips to 9 days that is quite bad!
Page 5 Read page 5 as text
3. Compare two restaurants: Taco Bell Hyde Park Steakhouse Competitive Priorities: Cost: 40 points Delivery: 30 points Quality: 15 Flexibility: 15 People go to Taco Bell because of their low cost and fast delivery. Quality is important in the sense that the food must be edible and not have any health problems, but not much more is expected. Flexibility is limited to different combinations of the same 8 – 10 ingredients. Cost: 10 Delivery: 15 Quality: 40 Flexibility: 35 The most important thing is high quality and high choice. Customers are willing to pay more money and wait a bit longer for a meal (but not spend too much money or wait too long.) Facilities: Very functional, limited space for dining, designed for productivity Very nicely decorated, much more “elbow room”, designed for customer comfort while productivity is a secondary concern. For example, having the bar in the front and kitchen in the back is definitely NOT the first choice of the waitstaff. This is done to appeal to customers and to get them to spend more money. Workforce: Very general and low skilled. More specialized and higher skilled – particularly in the kitchen. Quality Systems: Quality starts with conformance. Strict, standardized systems used to train all workers the same way to get the most out of low-cost, low skilled workers. Quality starts with the highly skilled workforce. More individualized training. Cooks go to specialized culinary schools. Technology: Very specialized. Example: cash registers with pictures and buttons for value meals to increase low skilled cashiers’ accuracy and speed. Very general purpose, primarily used to improve customer experience.
Page 6 Read page 6 as text
End of Chapter Case Questions Natural Designs, Inc. 1. What types of decisions must Jim McMaster make on a daily basis for Natural Designs to run smoothly? What kind of decisions must he make on a long-term basis? a. Structural decisions tend to be long-term. i. Capacity—Purchase additional equipment for customizing bird feeders (painting and carving)? Outsource production of custom bird feeders during busy times (fall and spring, in the case)? ii. Technology—Automate the customization process using an industrial robot, especially carving? iii. Facilities—Build new facility? iv. Vertical integration/sourcing—Buy a stake in a company that manufactures bird feeders? b. Infrastructural decisions tend to be shorter-term. i. Workforce—Increase full-time staff? Use temporary labor during busy season? ii. Production planning and scheduling (This is a bit beyond students’ knowledge base at this point.) iii. Quality systems—Survey customers itself (instead of relying on anecdotal evidence from retailers)? Hire a product inspector? iv. Organization—Create employee problem-solving teams? 2. Describe the operations strategy for Natural Designs. Has this strategy changed as a result of the custom bird feeder operation? If yes, how? a. This is somewhat quality based. Because McMaster was a science teacher and birding expert, customers can expect his feeders to have the right features. As they are made in a small domestic facility, customers can expect good levels of quality. However, because the processes do not appear to be highly automated, product consistency may not be paramount. b. With the carved and custom-painted products, the strategy has shifted toward product flexibility. 3. What might have been done differently to facilitate the offering of custom bird feeders? a. These could have been subcontracted to a company that can do custom carving and painting (or one company for each operation). Carving, in particular, is probably not a capability that the company has historically been good at. b. They could have offered fewer colors or quoted longer lead time. 4. How should McMaster analyze the alternative expansion options? Which would you recommend: a second facility or a move to a single larger facility? a. Note: Some good opportunities present to discuss operations’ alignment with other functional strategies. b. McMaster needs to think about how much demand will grow in the future and how certain he is about his estimate (Marketing–Operations interface). c. How much does he have to invest (Finance–Operations interface)? d. Is there another market, such as west coast or east coast, to which he would like to be closer (Marketing–Operations interface)? e. Can he, and does he, want to handle the management complexities that two locations create (HR–Operations interface)?
Page 7 Read page 7 as text
Chapter 2: Quality Management End of Chapter Problems 1. Zeta Automotive Limited Information Provided: Upper Tolerance Limit = 75 Lower Tolerance Limit = 70 Mean = 72 For Six Sigma Quality, the distance from the mean to upper and lower tolerance limits should be 6 standard deviations ( σ ). Using Upper Tolerance Limits : 6 * σ = (75 – 72) = 3 σ = 0.5 Using Lower Tolerance Limits : 6 * σ = (72 - 70) = 2 σ = 0.33 To ensure Six Sigma quality, the standard deviation should be lowered such that the distance from the mean to both Upper and Lower Control Limits are at-least 6 σ . Therefore σ should be lower to 0.33. 2. Internet Book Retailer Information Provided: Upper Tolerance Limit (UTL) = 36 hours Lower Tolerance Limit (LTL) = 24 hours Mean = 30 hours Standard Deviation = 4 hours a. The current process sigma level can be calculated by applying equation 1 (page 52) Using UTL Process Sigma = 4 30 36 − = 1.5 Using LTL Process Sigma = 4 24 30 − = 1.5 Therefore it can be concluded that the Internet Book Retailer is currently operating at 1.5 σ level. b. For Six Sigma Quality, the distance from the mean to upper and lower tolerance limits should be 6 standard deviations ( σ ).
Page 8 Read page 8 as text
Using Upper Tolerance Limits : 6 * σ = (36 – 30) = 6 σ = 1 Using Lower Tolerance Limits : 6 * σ = (30 - 24) = 6 σ = 1 To ensure Six Sigma quality, therefore σ should be lower to 1. 3. Pizza Delivery Company Information Provided: Upper Tolerance Limit (UTL) = 60 minutes Lower Tolerance Limit (LTL) = 0 minutes Mean = 40 minutes Standard Deviation = 10 minutes a. The current process sigma level can be calculated by applying equation 1 (page 52) Using UTL Process Sigma = 10 40 60 − = 2 Using LTL Process Sigma = 10 0 40 − = 4 Since the company promises to deliver pizza within an hour, UTL calculation is more relevant. Therefore we can conclude that the company is operating at a 2 σ level. b. For Six Sigma Quality, the distance from the mean to upper and lower tolerance limits should be 6 standard deviations ( σ ). As mentioned in the previous question, the use of UTL is more appropriate. Therefore Using Upper Tolerance Limits : 6 * σ = (60 – 40) = 20 σ = 3.33 minutes To ensure Six Sigma quality, therefore σ should be lower to 3.33 minutes. 4. Customer Service Center Information Provided: Upper Tolerance Limit (UTL) = 90 seconds Lower Tolerance Limit (LTL) = 30 seconds Table 2.5 lists waiting times for 50 customers. We can use this information to calculate mean and standard deviation:
Page 9 Read page 9 as text
Mean = 60.32 seconds Standard Deviation = 6.51 seconds. Current process sigma level can be calculated using the above information: Using UTL Process Sigma = 51 . 6 32 . 60 90 − = 4.56 Using LTL Process Sigma = 51 . 6 30 32 . 60 − = 4.66 We can conclude that the customer service center is not able to provide a six-sigma quality at this point. Their current process sigma level is 4.56 considering UTL and is 4.66 considering LTL. 5. Coffee Temperature Information Provided: Upper Tolerance Limit (UTL) = 180 degrees Lower Tolerance Limit (LTL) = 160 degrees Table 2.6 lists waiting times for 40 cups. We can use this information to calculate mean and standard deviation: Mean = 170.53 seconds Standard Deviation = 6.29 seconds. Current process sigma level can be calculated using the above information: Using UTL Process Sigma = 29 . 6 53 . 170 180 − = 1.51 Using LTL Process Sigma = 29 . 6 160 73 . 170 − = 1.67 We can conclude that the Café is not able to provide a six-sigma quality at this point. Their current process sigma level is 1.51 considering UTL and 1.67 considering LTL.
Page 10 Read page 10 as text
6. Video Game Console Information Provided: There are 10 production steps. Each step is operating at 5-sigma level. Therefore we can conclude that the distances from mean to UTL and LTL are at-least 5 standard deviations. Hence we can calculate the percentage of defective products made by each production step by calculating the area of the normal distribution curve above UTL and lower than LTL (hint: similar calculations are shown in Solved Example 1 on page 52). Percentage defective product considering UTL = 1 – NORMSDIST(5) = 0.0000002866 Percentage defective product considering LTL = NORMSDIST(-5) = 0.0000002866 Total percentage defective product = 0.0000002866 + 0.0000002866 = 0.0000005732 Therefore total percentage good product = 1 – 0.0000005732 = 0.9999994268 Since each production steps are independent of each other, the total percent of good product at the end of 10 production steps will be = (0.9999994268) 10 = 0.999994268 7. Electronic Product Information Provided: There are 12 production steps. For the first 6 steps : First 6 steps are operating at 5 sigma level Hence we can calculate the percentage of defective products made by each production step by calculating the area of the normal distribution curve above UTL and lower than LTL (hint: similar calculations are shown in Solved Example 1 on page 52). Percentage defective product considering UTL = 1 – NORMSDIST(5) = 0.0000002866 Percentage defective product considering LTL = NORMSDIST(-5) = 0.0000002866 Total percentage defective product = 0.0000002866 + 0.0000002866 = 0.0000005732 Therefore total percentage good product = 1 – 0.0000005732 = 0.9999994268 For the last 6 steps : The last 6 steps are operating at 5.5 sigma level
Page 11 Read page 11 as text
Percentage defective product considering UTL = 1 – NORMSDIST(5.5) = 0.000000019 Percentage defective product considering LTL = NORMSDIST(-5.5) = 0.000000019 Total percentage defective product = 0.000000038 Therefore total percentage good product = 1 – 0.000000038 = 0.999999962 Since each production steps are independent of each other, the total percent of good product at the end of 12 production steps will be = (0.9999994268) 6 * (0.999999962) 6 = 0.999996 8. Quick Service Restaurant Current Process There are 4 production steps. Each step is operating at 4-sigma level. Hence we can calculate the percentage of defective products made by each production step by calculating the area of the normal distribution curve above UTL and lower than LTL (hint: similar calculations are shown in Solved Example 1 on page 52). Percentage defective product considering UTL = 1 – NORMSDIST(4) = 0.00003167 Percentage defective product considering LTL = NORMSDIST(-4) = 0.00003167 Total percentage defective product = 0.00003167 + 0.00003167 = 0.00006334 Since each production steps are independent of each other, the total percent of good product at the end of 4 production steps will be = 1 – 0.00006334 (1 - 0.00006334) 4 = 0.99746664 New Process There are 8 production steps. Each step is operating at 5.5 sigma level. Percentage defective product considering UTL = 1 – NORMSDIST(5.5) = 0.000000019 Percentage defective product considering LTL = NORMSDIST(-5.5) = 0.000000019 Total percentage defective product = 0.000000038 Therefore total percentage good product = 1 – 0.000000038 = 0.999999962
Page 12 Read page 12 as text
(0.999999962) 8 = 0.999999696 Therefore by new process will slightly increase the percentage of error-free products (0.999999696 - 0.99746664 = 0.000253032). 9. Manufacturing Facility Sigma level for first step: 4.5 Therefore the percentage of good products made by this step = 0.9999932 (refer to earlier example on how to calculate percentage of good products) Sigma level for second step: 5 Therefore the percentage of good products = 0.9999994268 Sigma level for steps 3 and 4: 5.5 Therefore the percentage of good products = 0.999999962 Therefore percentage of good products after all four steps = 0.9999932 * 0.9999994268 * (0.999999962) 2 = 0.999992551 10. Quick Service Restaurant (Part 2) New Process There are 3 production steps each with same sigma level producing X% good products at each step. According to the information provided, the new process has the same overall sigma level as the original process with 4 steps. Therefore the new process and the old process should have same number of good products. Therefore X * X * X = 0.99746664 Or X = 0.99915 In other words, the area under the normal distribution from LTL to UTL is 0.99915. Therefore area outside the tolerance limits (or % defective products at each step) = 0.000845
Page 13 Read page 13 as text
Assuming that the area is equally distributed beyond UTL or LTL, area of each tail is: 0.000423 A NORMSINV function can be used to find the sigma level corresponding to LTL NORMSINV(0.000423) = -3.33 Similarly we can find sigma level corresponding UTL as 1 – NORMSINV(0.000423) = +3.33 End of Chapter Case Questions The Case of the Complaining Customer 1. Why is Mr. Shelton upset? What should be done to address his complaint? Mr. Shelton is upset because the dry-cleaner lost his laundry. However, he is also justifiably upset about the way his complaint was mishandled. As Shelton is a regular customer (along with his wife), his business is very valuable. It is worth meeting his demands to keep his business. For example, if Presto makes $12 on the Shelton’s business per week, it would only take 1 year to recoup the $600 that Mr. Shelton is requesting. Additionally, word of mouth and reputation are important, as the chapter demonstrates. This is another reason to placate Mr. Shelton. 2. Based on the information presented in the case, develop a comprehensive quality improvement plan for Presto Cleaner. The Six Sigma DMAIC protocol forms the basis of a good improvement plant. Define: The current process for checking in, tracking, and checking out laundry cannot guarantee that the right laundry is returned to customers when they arrive for pickup. The resolution process when laundry is lost is inadequate. Measure: Currently, Presto does not know how often or how much laundry is being lost. It does not know the dollar value of the lost laundry or the impact on customer retention. It also needs to know the amount of time it takes to resolve lost-item issues. Analyze: Presto should map the processes involved in checking in, tracking, and checking out laundry, as well as the process for locating lost items and returning them to customers. Looking at the process of managing lost laundry, it appears that there are parts of the process that are candidates for improvement. This types of mapping often makes clear many gaps that must be closed. For example, there is no process for identifying customers who have items missing when items that may be theirs come into the store (per item 2 in Hoffner’s memo). Per item 5 in the memo, there appears to be no process by which stores receiving lost items can notify other stores (which might be looking for the items). Improve: Opportunities for process improvements are apparent from the correspondence in the case. For example, currently all correspondence between the plant, stores, and headquarters must be in writing. This requirement should probably be eliminated. Other procedures should probably be added. For example, having a clerk simply compare the number of items on a return ticket to the number of items in a bundle would alert staff to some problems before bundles are returned to customers. Process analysis should bring to
Page 14 Read page 14 as text
light many improvement opportunities. These can be evaluated on the basis of cost, feasibility, and the portion of the problem that they will solve. Control: Process for employee training, written manuals, and other controls will need to be put into place to ensure that the new procedures are institutionalized.
Page 15 Read page 15 as text
Chapter 3: New Product Development End of Chapter Questions 1. Examples of successful new products and reasons. Goods : Nintendo Wii video game console. This platform and its innovate games such as Wii Fit, Wii Sports have changed the way a player interacts with a video game system. iPhone : iPhone has combined the functionalities of a traditional mobile phone with many new applications using a very user-friendly interface. Services : Netflix : NetFlix has 10 million subscribers who can select from 100,000 movies or TV titles. Subscribers get DVDs by mail and can also instantly watch movies over the internet. Facebook : With 132 million users in February 2009 (this number is growing very rapidly) Facebook has been THE social networking website of choice. It offers many innovative services such as giving user the ability to give thumbs up or thumbs down to an advertisement and the ability to add third-party applications (e.g. for book reviews, video uploads). Below are examples of failed new products and reasons Goods: McDonald’s Arch Deluxe Burger : While many customers thought that the burger itself was tasty, this product was not consistent with the needs of McDonald’s customers. Therefore the product could not generate enough sustained demand. New Coke : This product tried to replace a product which was already very popular and liked by the customers. Services: Webvan : The company promised to deliver groceries to users home. Users went to Webvan website and not only placed the order for specific items but also specified a narrow delivery window. This service was offered in three cities but the costs of delivery promise were too high to cover with the slow growth in market share. Google Dodgeball : In 2005, Google purchased the social networking phone application, Dodgeball. It let you find friends of friends, find friends within a 10 block radius, get alerts when "crushes" were nearby, and locate restaurants. While Dodgeball.com was innovative for the time, Google didn't seem to dedicate a lot of resources toward expanding coverage areas or features. It was only available in select cities, while competing Twitter grew in popularity and was available everywhere. The original Dodgeball.com founders left the
Page 16 Read page 16 as text
company in 2007, and in 2009 Google announced that they were shutting the service down. (Source: http://google.about.com/od/blogs/ig/Google-Graveyard-/Dodgeball.htm ) 2. Examples of products in different stages of the lifecycle in various industries: Industry Introduction Growth Maturity Decline Pharmaceutical Bio- technology based medicines Lifestyle drugs (e.g Viagra) Aspirin Computer Cloud computing Palmtop (or mini) Laptop PC Desktop PC Mainframe PC Automobile Plug-in hybrid automobiles Hybrid automobiles Minivans Station wagons Hotel High-Tech Limited Service Hotels Boutique Hotels Large Convention Hotels Bed and Breakfast Inn Healthcare Ayurvadic medicine Health tourism Large general purpose hospitals Midwife administered birthing centers Entertainment Adventure tourism Internet- based TV and movie rental TV VCR 3. Continuous innovation allows improved performance without changing consumption or customer behavior. Examples include Kellogg’s adding to it’s Eggo® line with Nutri Grain® Strawberry Filled waffles. Radical innovation as either a service or product significantly changes both behavior and consumption. An example is a customer purchasing & printing airline boarding passes on line. The goal of blue ocean strategy is to make the competition irrelevant by establishing a new product, service, or experience within an uncontested market. Examples include American Girl which started as a Wisconsin doll manufacturer and has expanded into an entire vacation experience for girls and their families.
209 more pages in the full document
Unlock it once and it stays in your library, ready to chat with or turn into flashcards.
Unlock the full documentMore Operations Management study materials
See all Textbook Guides
Solution Manual for Operations and Supply Chain Management, 14th Edition
Operations Management
342 pages133downloadsFeb 2025 Textbook Guides
Managing Quality: Integrating the Supply Chain, 6th Edition Solution Manual
Operations Management
262 pages115downloadsFeb 2025 Textbook Guides
Operations Management, (Mcgraw-hill Education Operations and Decision Sciences) 1st Edition Solution Manual
Operations Management
153 pages91downloadsFeb 2025 Textbook Guides
Solution Manual For Matching Supply with Demand: An Introduction to Operations Management, 4th Edition
Operations Management
76 pages36downloadsFeb 2025 Exam Guides
Operations Management, 5th Canadian Edition Test Bank
Operations Management
1208 pagesMay 2025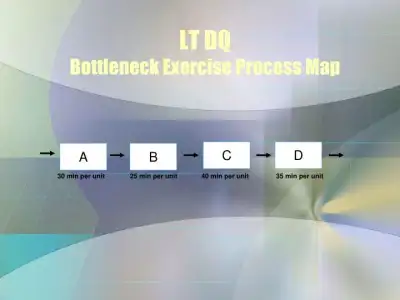 Class Notes
LT DQ Bottleneck Exercise Process Map
Operations Management
1 pageMay 2025 Textbook Guides
Solution Manual for Introduction to Materials Management, 8th Edition
Operations Management
44 pagesMay 2025 Solved Assignments
Analysis of Economic Order Quantity (EOQ) and Production Order Quantity (POQ) Models for Inventory Management
Operations Management
4 pagesMay 2025
Study this document with CramX
Once it is in your library, every tool can work from it.