Strategic Management, Task 2

Analysis of strategic decision-making in various business scenarios.

Ava Martinez
Contributor
4.7
44
10 months ago
Preview (6 of 18 Pages)
100%
Log in to unlock

Page 1

Strategic Management, Task 2 - Page 1 preview image

Loading page ...

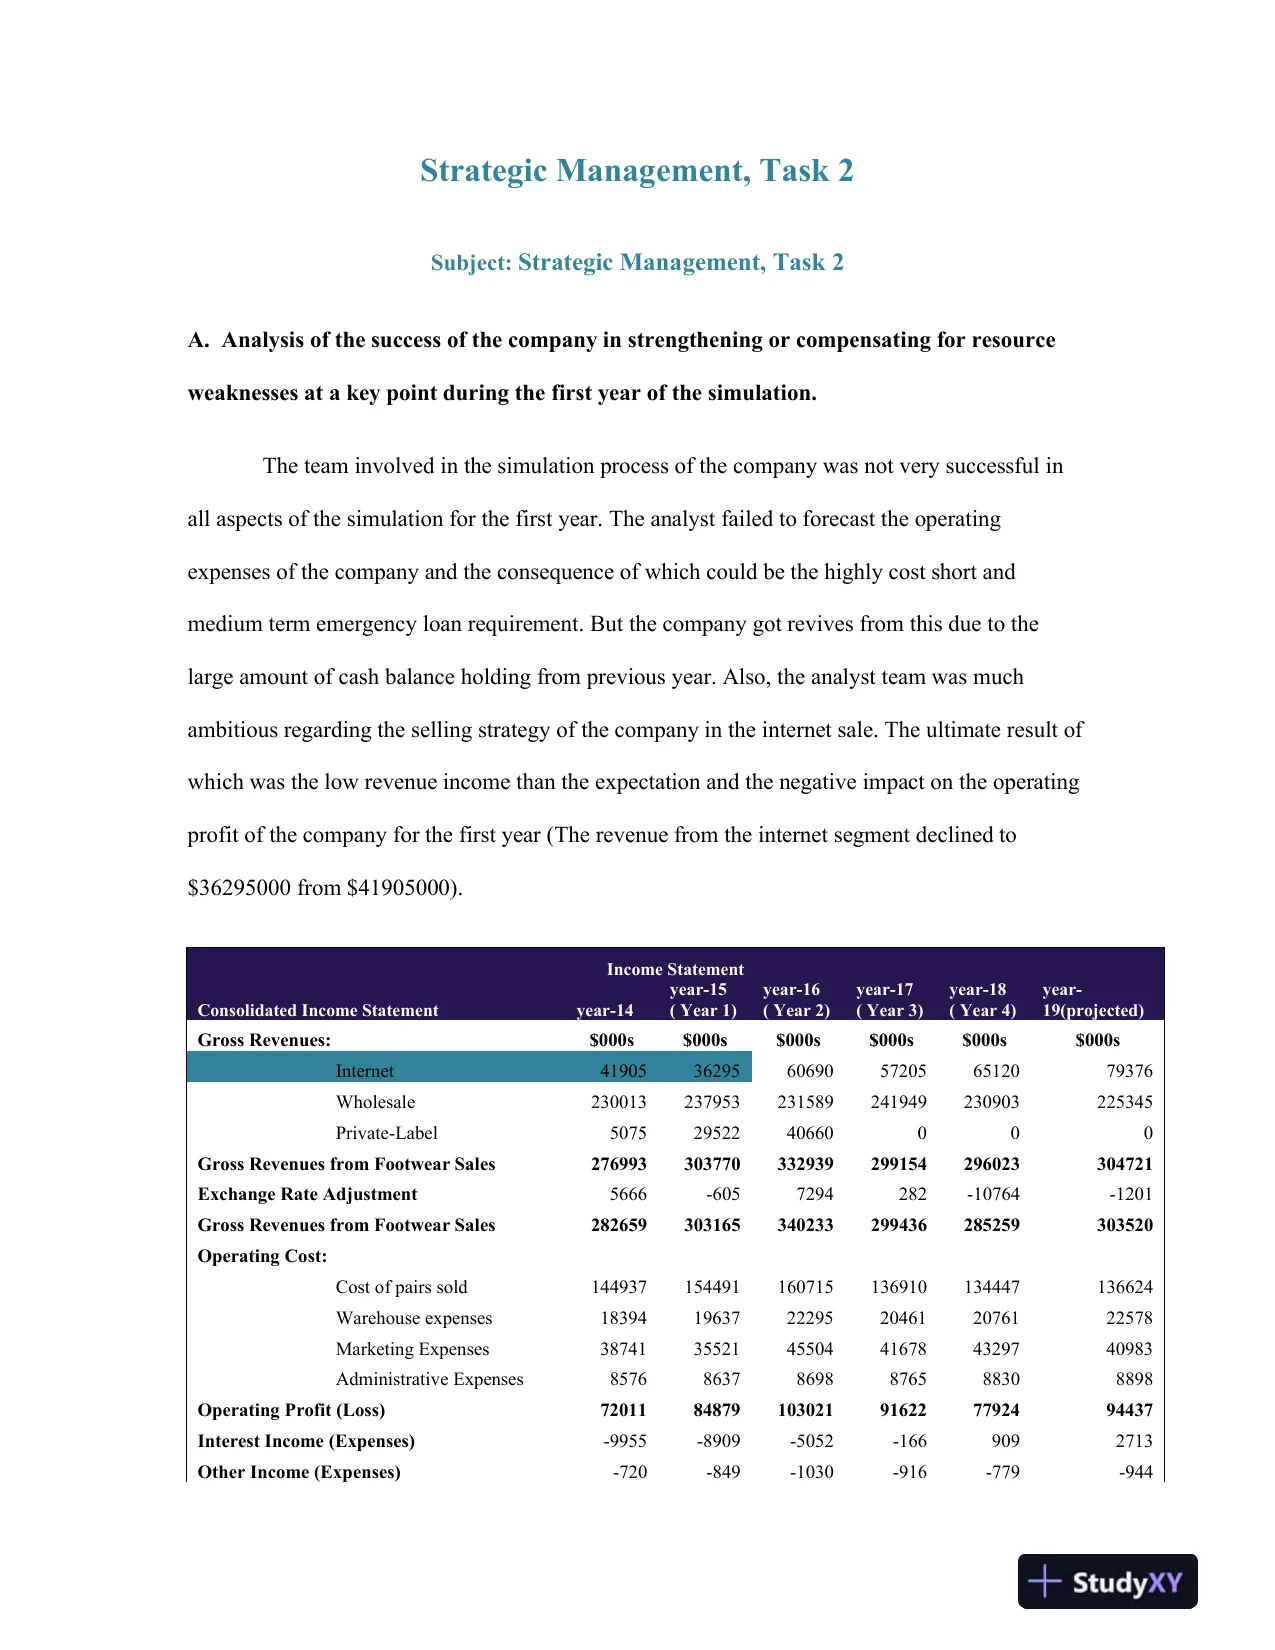
Strategic Management, Task 2Subject:Strategic Management, Task2A. Analysis of the success of thecompanyinstrengthening or compensating for resourceweaknesses at a key point during thefirst yearof the simulation.The team involved in the simulation process of the company was not very successfulinall aspects of the simulation for the first year.The analyst failed to forecast the operatingexpenses of the company and the consequence of whichcould bethe highlycost short andmedium term emergency loanrequirement.But thecompany got revivesfrom this due tothelarge amountofcash balance holding fromprevious year.Also, the analyst team was muchambitiousregarding the selling strategy of the companyin the internet sale.The ultimate result ofwhichwas the low revenueincomethantheexpectationandthe negative impact on the operatingprofit of the company for the first year(The revenue from the internet segment declined to$36295000 from $41905000).Income StatementConsolidated Income Statementyear-14year-15( Year 1)year-16( Year 2)year-17( Year 3)year-18( Year 4)year-19(projected)Gross Revenues:$000s$000s$000s$000s$000s$000sInternet419053629560690572056512079376Wholesale230013237953231589241949230903225345Private-Label50752952240660000Gross Revenues from Footwear Sales276993303770332939299154296023304721Exchange Rate Adjustment5666-6057294282-10764-1201Gross Revenues from Footwear Sales282659303165340233299436285259303520Operating Cost:Cost of pairs sold144937154491160715136910134447136624Warehouse expenses183941963722295204612076122578Marketing Expenses387413552145504416784329740983Administrative Expenses857686378698876588308898Operating Profit (Loss)7201184879103021916227792494437Interest Income (Expenses)-9955-8909-5052-1669092713Other Income (Expenses)-720-849-1030-916-779-944

Page 2

Strategic Management, Task 2 - Page 2 preview image

Loading page ...

Page 3

Strategic Management, Task 2 - Page 3 preview image

Loading page ...

Pre-Tax Profit (Loss)613367512196939905407805496206Income Taxes184012253629082271622341628862Net Profit (Loss)429355258567857633785463867344The analyst teammade decisions regarding the necessary resourcesearly on in thesimulationprocess. Later on,theexpectation about the sales figure was made and the costrequired to generate the expected sales was forecasted. But,attention wasnotdrawntoincorporating the fact that the expansion of the business along with the geographic regions andother market segments requires extra resources for the company. As a result, the companystretcheditsfinancialcapital &resources extremely thin.Also, the analyst team wasveryambiguousregarding theinitial selling strategyof the company but failed to incorporate thefactthat initially the sales of the company may notbeexpected due to slow acceptance of the productin the new markets.At the end ofthe first year the company began to sell in the multiple marketsegments and geographically expanded its operations.The company attemptedto introduce andsell the products in the new market segments require high cost involvement for the inboundlogistics, outbound logistics,salesoffices, new store set up, marketing activities, employeecompensation,tariffetc.The costof the pairs sold, warehouse expenses, marketing expenses andadministrative expenses all increased in the first year of simulation.Income StatementConsolidated Income Statementyear-14year-15( Year 1)year-16( Year 2)year-17( Year 3)year-18( Year 4)year-19(projected)Gross Revenues:$000s$000s$000s$000s$000s$000sInternet419053629560690572056512079376Wholesale230013237953231589241949230903225345Private-Label50752952240660000Gross Revenues from Footwear Sales276993303770332939299154296023304721Exchange Rate Adjustment5666-6057294282-10764-1201Gross Revenues from Footwear Sales282659303165340233299436285259303520Operating Cost:Cost of pairs sold144937154491160715136910134447136624Warehouse expenses183941963722295204612076122578Marketing Expenses387413552145504416784329740983

Page 4

Strategic Management, Task 2 - Page 4 preview image

Loading page ...

Administrative Expenses857686378698876588308898Operating Profit (Loss)7201184879103021916227792494437Thissituation created a value chaincrisis forthe company as revenue was not enough tosupport the initial high cost of the value creation cost.The company suffered a huge problem inthe first year for this miscalculation in available resources. The actual expansion of the companywas hampered largely.Theanalyst team should be conservative regarding theselling strategyfor the first fewyears especially when the strategy is designed for the new market.Moreover, it was required toeffectivelyincorporate the needs of necessary resources to support the market expansion.B. Analysis of the actions to develop theresources’strength at a key point during the lastfouryearsof the simulation.The company was unsuccessful as to properly tapresources strengths in the first year ofthe simulation.So,thecompanyinitiated totake some actions that will ensure the development ofthecompany’s resource strengthsas well as to resolve the financial situation created in the firstyear of the simulation.Several decisionsweretakenin the simulation beginningin the year two.Thecompanybought some change in theselling strategy.In themid of thesecond year, thecompanydecidedto stop selling in some geographicregionswhere the response from the customers to the product were very slow in spite of extremelevel selling and promotional effortson the online.The concentration was made to set up moreretail outlet in those geographic areas where the company got more responds from the customersand conduct more online promotion to these areas from where the company got high internet

Page 5

Strategic Management, Task 2 - Page 5 preview image

Loading page ...

responses.Also, as the costofproduct offering to the private level customer deemed tovery highand thusthe company decidedto stop serving this type ofcustomers.By closing the business activities from the unprofitable segments the companysignificantlycurtaileditsoperatingexpenses(logistics, employee,marketing,service center).This was an improvement for the company. The resources that would be tied up toanunsuccessful ventureweremadefree to inject in a profitable venture.The financial condition ofthe company wasimprovedlater on this decision.The ultimate resultsofthese decisionswerethelower operating cost in the year 3 of the simulation and high profit from the wholesale andinternet segment.Income StatementConsolidated Income Statementyear-14year-15( Year 1)year-16( Year 2)year-17( Year 3)year-18( Year 4)year-19(projected)Gross Revenues:$000s$000s$000s$000s$000s$000sInternet419053629560690572056512079376Wholesale230013237953231589241949230903225345Private-Label50752952240660000Gross Revenues from Footwear Sales276993303770332939299154296023304721Exchange Rate Adjustment5666-6057294282-10764-1201Gross Revenues from Footwear Sales282659303165340233299436285259303520Operating Cost:Cost of pairs sold144937154491160715136910134447136624Warehouse expenses183941963722295204612076122578Marketing Expenses387413552145504416784329740983Administrative Expenses857686378698876588308898Operating Profit (Loss)7201184879103021916227792494437B1.Assessment ofhow competitively powerful that strength was.The company’s decision to stop business in unprofitable geographic regions was aneffectivedecision to the success of the company.The strength resulted from the stopping of thesales in the unprofitable geographic segments&serving private level customersand more

Page 6

Strategic Management, Task 2 - Page 6 preview image

Loading page ...

concentration to the online marketwas competitively powerful as it helped the company torecover the poor financial condition attributed by the wrong decisions madeatthe start of thesimulation.In thesecondyear of the simulation, the net income of the company increased and thisincrease continued for the subsequent years. This persistent trend of the revenue growth wasdefinitely a consequential strength for the company.The following table depicts the positive trendin the revenue for the online (internet) and wholesale market. Apparently, the revenue of thewholesales seems to decrease over the time period, but this decrease is mainly attributed by thestopping of the sales from unprofitable segments gradually. In fact, during this recovery period,the company was capable to examine its different brands and screen out the appropriate brandsfor offerings. This enabled the company to capturemore marketshare. The company wassuccessfully able to capture the ‘traveler’ market segment at the end ofthirdyear(market shareincreased 14% to 25%).Also, the market share of the ‘cost cutter’ segment increased from 20%to 26%.Income StatementConsolidated Income Statementyear-14year-15( Year 1)year-16( Year 2)year-17( Year 3)year-18( Year 4)year-19(projected)Gross Revenues:$000s$000s$000s$000s$000s$000sInternet419053629560690572056512079376Wholesale230013237953231589241949230903225345Private-Label50752952240660000Company was able to avoid its unnecessary operating cost (warehouse expenses,administrative expenses and administrative expenses, cost forlogistic support) incurred in theunprofitable market segments. In the third year of the simulation the operating cost of thecompany reduced.Income StatementConsolidated Income Statementyear-14year-15year-16year-17year-18year-
Preview Mode

This document has 18 pages. Sign in to access the full document!