

Math220--Assignment # 2
- Mathematics
- American Public University
- 6 pages
- Shared May 2025
Mathematical assignment focusing on algebra, calculus, and statistical applications.
Preview 2 of 6 pages
See the first 2 pages exactly as they appear in the document.
Page 1 Read page 1 as text
1 Math 220 -- Assignment # 2 Question 1 . (Minitab) The U.S. government ( http://www.eia.gov/totalenergy/data/annual ) collects data on energy consumption per capita for each state and the District of Columbia. The p rovided data file shows the energy consumption per capita (in million Btu) for the year 2010 . a) Make a histogram of the data. b) Obtain the boxplot of the data. c) Find the five - number summary, the mean, and the standard devi ation of the per capita energy consumption in the 50 states and the District of Columbia . d) Use the output to write a brief report on the distribution of energy consumption per capita in the U.S. in the year 2010 . Make sure you identify any outlying st ates in energy consu mption usage. How was energy consumption in your home (or adopted) state in 2010 ? Minitab Instructions : a), b), and c): We obtain at once histogram, boxplot, and summary statistics by doing the following: - Choose 'Stat → Basic Statistics → Display Descriptive Statistics' - Select the Energy Consumption variable for the 'Variables' Box - Click the ‘Graphs’ dialog box open - Select ‘Histogram of data’ and ‘Boxplot of data’ and press Enter twice The output will give you the summary stats (in the session window), histogram, and boxplot (on separate graph windows). There is no need to edit the graphs. Take all of this to your MS Word file and produce a nice description of the output. You may want to create a table such as the one below to report the statistics: Instructions: 1. Choose Graph > Histogram . 2. Choose Simple , then click OK . 3. In Graph variables , enter the data (Consumption). 4. Click OK . a) The obtained histogram is, 900 800 700 600 500 400 300 200 20 15 10 5 0 Energy Consumtion per cap Frequency Histogram of Energy Consumtion per cap Most of the consumption is between 200 and 400 . However, the distribution of per capita consumption is positively skewed. b) Interpreting the results Interpretation: The boxplot shows: 1. The median consumption score is 316.1. 2. The interquartile range is 280 to 410 . 3. O utliers are present. 4. The range is 187.4 to 948.1 . 5. The longer right whisker and large box area above the median indicate that the data have a slight positive skewness - the right tail of the distribution is longer than the left tail. c)
Page 2
4 more pages in the full document
Unlock it once and it stays in your library, ready to chat with or turn into flashcards.
Unlock the full documentMore Mathematics study materials
See all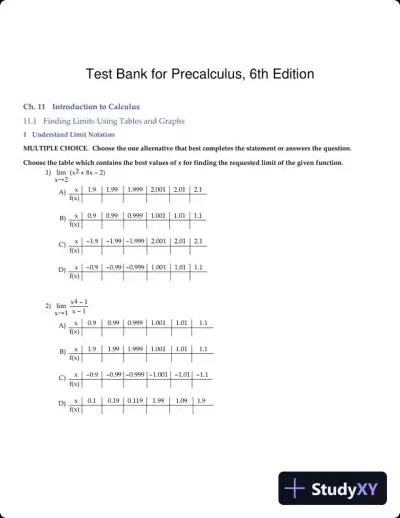 Exam Guides
Test Bank for Precalculus, 6th Edition
Mathematics
1051 pages175downloadsFeb 2025 Textbook Guides
Solution Manual For Introduction To Management Science, 11th Edition
Mathematics
437 pages167downloadsFeb 2025 Textbook Guides
Solution Manual For Derivatives Markets, 3rd Edition
Mathematics
358 pages143downloadsFeb 2025 Textbook Guides
Solution Manual for Geometry, 1st Edition
Mathematics
446 pages141downloadsFeb 2025 Textbook Guides
Solution Manual for Beginning Algebra, 7th Edition
Mathematics
479 pages139downloadsFeb 2025 Textbook Guides
Solution Manual for Developmental Mathematics, 1st Edition
Mathematics
1623 pages137downloadsFeb 2025 Textbook Guides
Solution Manual for Elementary and Intermediate Algebra: Graphs and Models, 5th Edition
Mathematics
1278 pages126downloadsFeb 2025 Exam Guides
Test Bank for Calculus: Concepts and Contexts, Enhanced 4th Edition
Mathematics
687 pages122downloadsFeb 2025
Study this document with CramX
Once it is in your library, every tool can work from it.