

Economics - Aggregate Demand and Aggregate Supply
- Economics
- Texas A&M University
- 15 pages
- Shared March 2026
Preview 5 of 15 pages
See the first 5 pages exactly as they appear in the document.
Page 1 Read page 1 as text
Study Guide Economics – Aggregate Demand and Aggregate Supply 1. Aggregate Demand (AD) Curve 1.1 What Is Aggregate Demand? In macroeconomics, we do not study just one product at a time. Instead, we look at the entire economy . So, the demand for all goods and services together is called aggregate demand (AD) . In the same way, the supply of all goods and services together is called aggregate supply (AS) . Just like individual demand and supply, aggregate demand and aggregate supply can be shown using: • a table (schedule), • a graph (curve), or • a mathematical equation. 1.2 The Aggregate Demand Curve The aggregate demand curve shows the total quantity of goods and services that people are willing to buy in an economy at different price levels .
Page 2 Read page 2 as text
Study Guide Understanding the Axes • Vertical axis (Y - axis): Price level of all final goods and services o Measured using the GDP deflator or Consumer Price Index (CPI) • Horizontal axis (X - axis): Real GDP o Measures the total output of goods and services in the economy 1.3 Why Is the Aggregate Demand Curve Downward Sloping? The aggregate demand curve slopes downward from left to right . This means: • When the price level falls , real GDP demanded increases • When the price level rises , real GDP demanded decreases Important point: The reasons for this downward slope are different from the reasons behind the downward slope of demand for a single product.
Page 3 Read page 3 as text
Study Guide 1.4 Why Individual Demand Logic Does Not Apply Here For a single good , we assume: • prices of other goods stay the same • consumer income stays the same But for aggregate demand : • many prices change together • wages also change • incomes change as well Because of this, we cannot use the same explanation as individual demand curves. Instead, there are three special effects that explain the downward slope of the AD curve. 1.5 Three Reasons for the Downward - Sloping AD Curve 1. Wealth Effect • The government keeps the money supply constant • Money represents the wealth of the economy When the price level rises : • purchasing power of money falls • people feel poorer • spending on goods and services decreases When the price level falls : • purchasing power of money rises • people feel wealthier • spending increases
Page 4 Read page 4 as text
Study Guide 2. Interest Rate Effect • Higher prices mean households and firms need more money for transactions • But the money supply is fixed As demand for money increases: • interest rates rise Higher interest rates: • reduce investment and borrowing • lower spending on interest - sensitive goods 3. Net Exports Effect • When domestic prices rise: o foreign goods become cheaper → imports increase o domestic goods become more expensive abroad → exports decrease Net exports = Exports − Imports When imports rise and exports fall, net exports decrease Since net exports are part of GDP, real GDP demanded falls as prices rise.
Page 5 Read page 5 as text
Study Guide 1.6 Changes in Aggregate Demand (Shifts in the Curve) Rightward Shift (AD ₁ → AD ₂ ) • More real GDP is demanded at the same price level • Indicates economic expansion Leftward Shift (AD ₁ → AD ₃ ) • Less real GDP is demanded at the same price level • Indicates economic slowdown or recession 1.7 What Causes Shifts in Aggregate Demand? Important: Aggregate demand does NOT shift because of changes in the price level. Instead, it shifts due to changes in:
10 more pages in the full document
Unlock it once and it stays in your library, ready to chat with or turn into flashcards.
Unlock the full documentMore Economics study materials
See all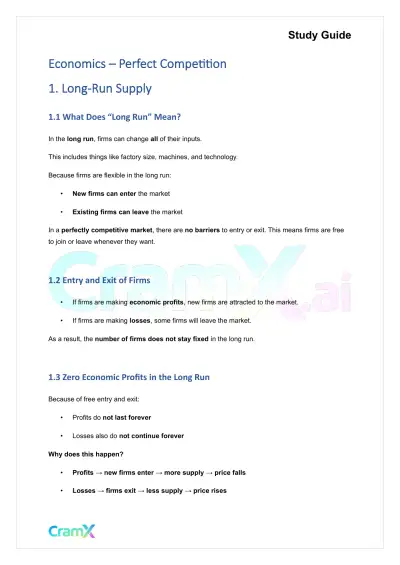 Quick Guides
Economics - Perfect Competition
Economics
18 pagesMar 2026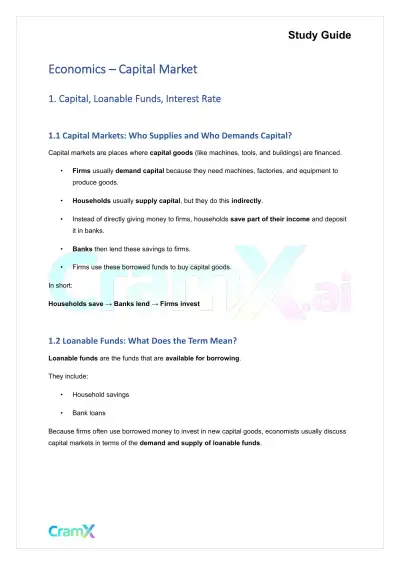 Quick Guides
Economics - Capital Market
Economics
12 pagesMar 2026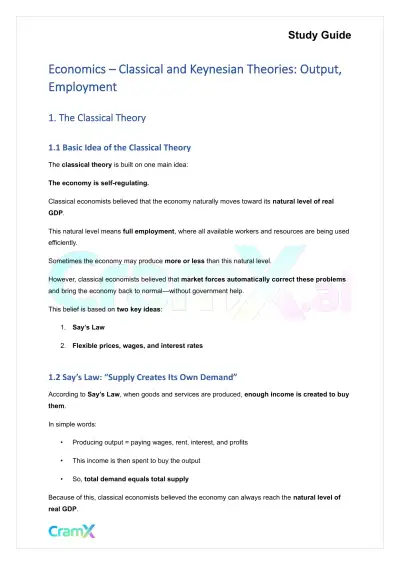 Quick Guides
Economics - Classical and Keynesian Theories Output, Employment
Economics
11 pagesMar 2026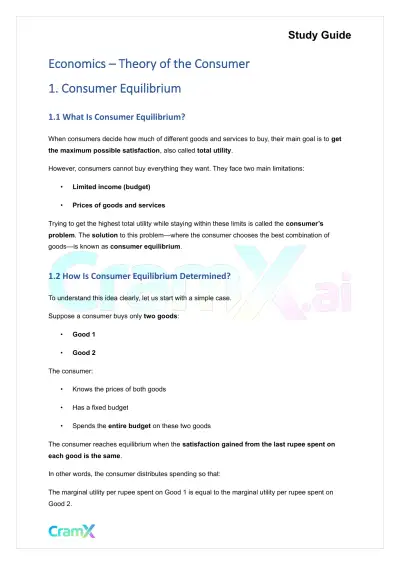 Quick Guides
Economics - Theory of the Consumer
Economics
14 pagesMar 2026 Quick Guides
Economics - Theory of the Firm
Economics
15 pagesMar 2026 Quick Guides
Economics - Labor Market
Economics
12 pagesMar 2026 Quick Guides
Economics - Monopolistic Competition and Oligopoly
Economics
18 pagesMar 2026 Quick Guides
Economics - Introduction
Economics
12 pagesMar 2026
Study this document with CramX
Once it is in your library, every tool can work from it.