CramX Logo
Solution Manual for Economics Today The Macro View, 20th Edition - Document preview page 1

Solution Manual for Economics Today The Macro View, 20th Edition - Page 1

Document preview content for Solution Manual for Economics Today The Macro View, 20th Edition

Solution Manual for Economics Today The Macro View, 20th Edition

Solution Manual for Economics Today The Macro View, 20th Edition is packed with detailed solutions to help you grasp concepts effortlessly.

Henry Martinez
Contributor
4.4
112
over 1 year ago
Preview (31 of 556 Pages)
100%
Log in to unlock
Page 1 of 31
Solution Manual for Economics Today The Macro View, 20th Edition - Page 1 preview image
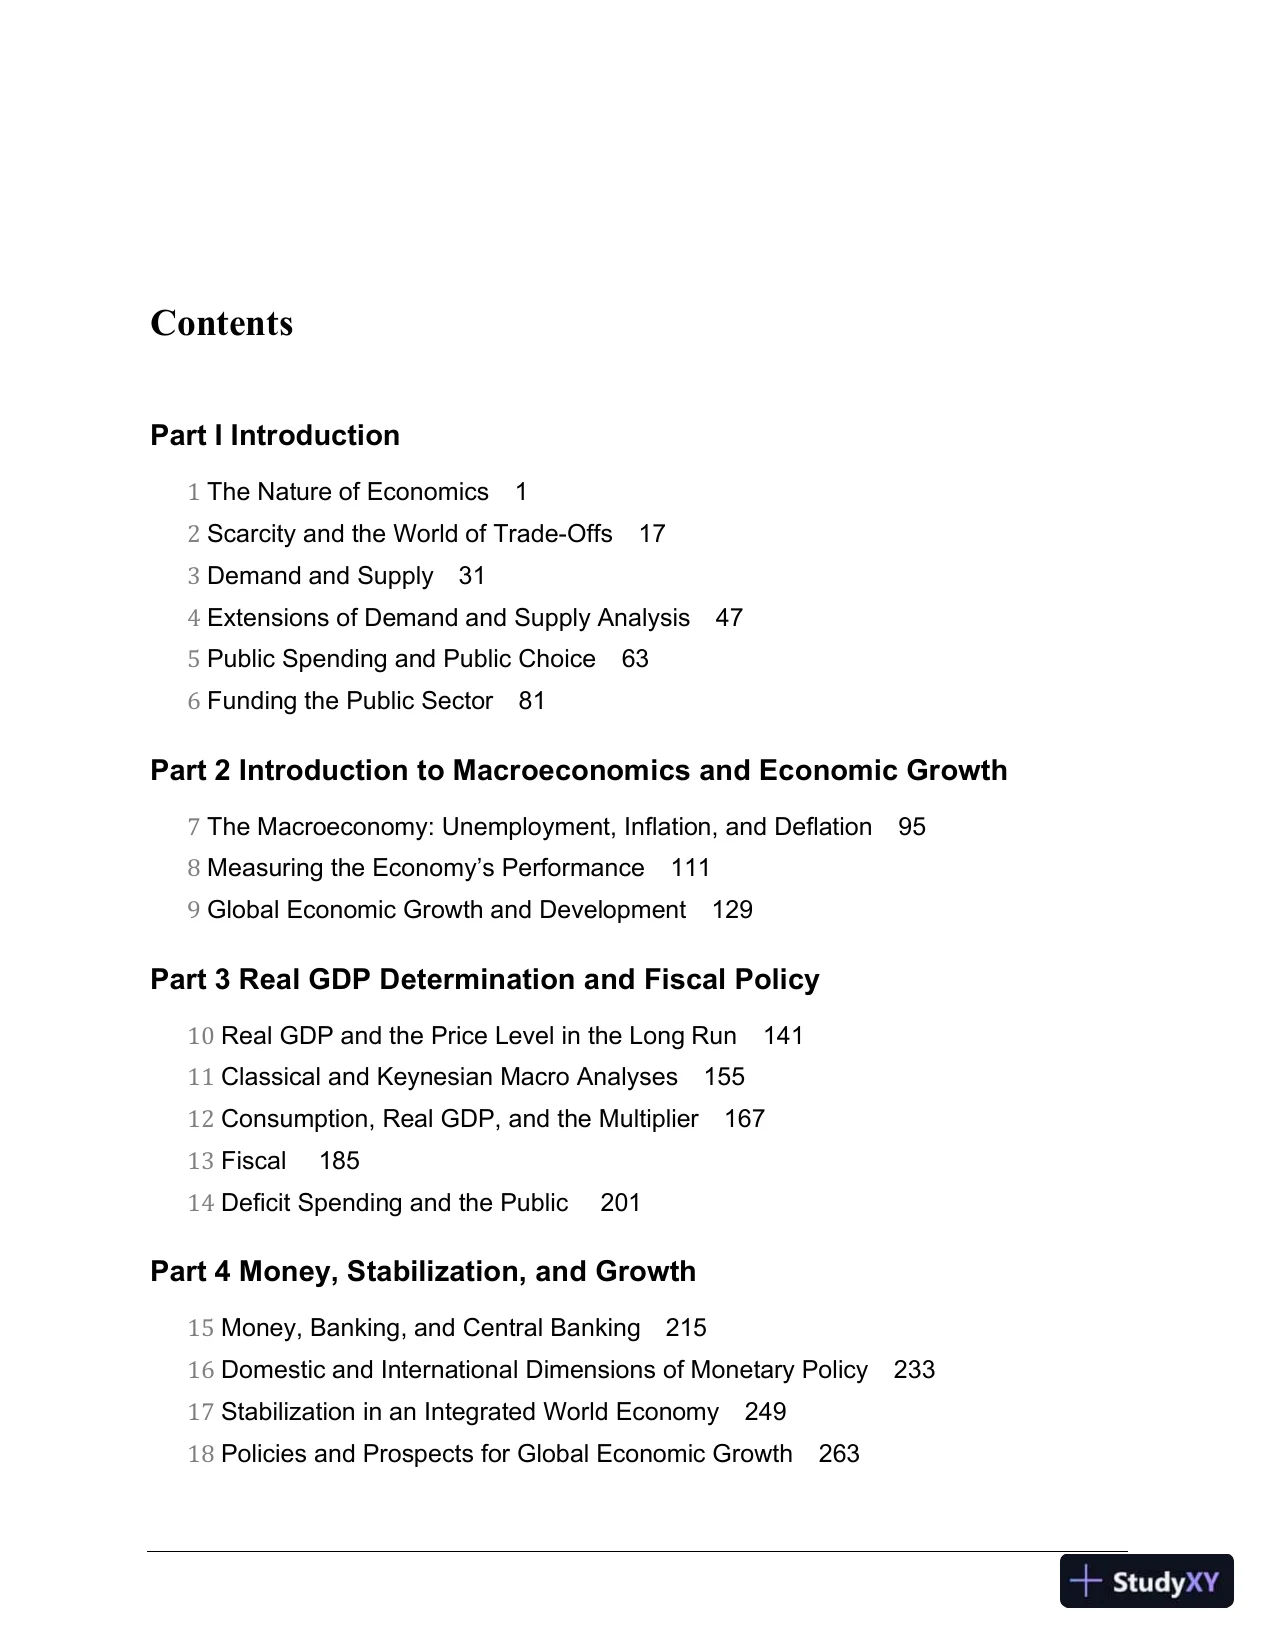
ContentsPart IIntroduction1The Nature of Economics12Scarcity and the World of Trade-Offs173Demand and Supply314Extensions of Demand and Supply Analysis475Public Spending and Public Choice636Funding the Public Sector81Part 2 Introduction to Macroeconomics and Economic Growth7The Macroeconomy: Unemployment, Inflation, and Deflation958Measuring the Economy’s Performance1119GlobalEconomic Growth and Development129Part 3 Real GDP Determination and Fiscal Policy10Real GDP andthePrice Level in the Long Run14111Classical and Keynesian Macro Analyses15512Consumption, Real GDP, and the Multiplier16713Fiscal18514Deficit Spending and the Public201Part 4 Money, Stabilization, and Growth15Money, Banking, and Central Banking21516Domestic and International Dimensions of Monetary Policy23317Stabilizationin an Integrated World Economy24918Policies and Prospects for Global Economic Growth263
Page 2 of 31
Solution Manual for Economics Today The Macro View, 20th Edition - Page 2 preview image
Page 3 of 31
Solution Manual for Economics Today The Macro View, 20th Edition - Page 3 preview imageivMillerEconomics Today,Eighteenth EditionPart 5 Dimensions of Microeconomics19Demand and Supply Elasticity27520Consumer Choice28721Rents, Profits, and the Financial Environment of Business305Part 6 Market Structure, Resource Allocation, and Regulation22The Firm: Cost and Output Determination31923Perfect Competition33324Monopoly34925Monopolistic Competition36326Oligopoly and Strategic Behavior37927Regulation and AntitrustPolicy in a Globalized Economy393Part 7 Labor Resources and the Environment28The Labor Market:Demand, Supply, and Outsourcing40929Unionsand Labor Market Monopoly Power42330Income, Poverty, and Health Care43731Environmental Economics451Part 8 Global Economics32ComparativeAdvantage and the Open Economy46533Exchange Rates and the Balance of Payments477Lecture Extenders489
Page 4 of 31
Solution Manual for Economics Today The Macro View, 20th Edition - Page 4 preview imageLecture Extender ExamplesChapter 1The Nature of EconomicsThe Perceived Value of GiftsAt Christmas and birthdays,aunts, uncles, grandparents, and parents give gifts to their college-aged lovedones. Joel Waldfogel, an economist at Yale University, surveyed several thousand college students afterChristmas to find out the value of holiday gifts as perceived by the students. He found that CDs andouterwear (coats and jackets) had a perceived value about equal to their actual cash value. By the time hegot down to socks, underwear, and cosmetics, the students’ evaluation was only about 85 percent of thecash value of the gift. What argument can be made against the idea of substituting cash or gift certificatesfor physical gifts?Physical gifts show that the giver has gone to the trouble to try to find a gift that will please the recipient.Such an effort can be viewed as caring, whereas a gift of cash or a gift certificate may not send such a message.Student Printing in the UniversityMost universities allow students to use university network printers in student labs when they are workingon the university network as part of their tuition or computer use or technology fees charged to studentswhen they register for classes. The average school spends several thousand dollars per month for thisservice. This service is expensive because students print personal jobs unrelated to academics, such asdownloads from entertainment Web sites and photos of friends and family. Winthrop University in SouthCarolinadecided to charge students a $10 printing fee that allows them to print 250 pages per semester onUniversitynetwork printers. After that, the students are charged $0.04 for each additional page that theyprint. Assumingstudents are rational, what do you predict happened to Winthrop’s printing costs afterthey implemented this charge? Why?Winthrop’s printing costs declined by about one-half. Students had been printing some pages that hadlittle additional value to them because those pages were essentially free. Once each page costssomething toprint, rational students printed only those pages that were worth the price charged to them.Are Economics Students Rational?If you did a survey in your economics class, not all students would agree with the statement “I amrational.”In an attempt to show that the rationality assumption is accurate nonetheless, an increasingnumberof economists are doing the same kinds of experiments that are used in the physical sciences. Oneresearcher, David M. Grether, ran some experiments at the University of California at Los Angeles in theearly 1980s. His experiment involved separating students as volunteers into two groups. One group waspaid the same, $7, no matter how it performed. The second group was paid less for poor performance andmore for better performance. This group was paid either $5 or $25, depending on the level ofperformance. Performance was measured by how well students were able to pick gambles that had thegreatest probability of winning. Students had to do some relatively complicated math calculations to makethe best guess.The results were consistent with the rationality assumption. One-third of the students in the group thatwas paid regardless of performance picked all of the gambles correctly. In the second group, for which
Page 5 of 31
Solution Manual for Economics Today The Macro View, 20th Edition - Page 5 preview image490MillerEconomics Today,Eighteenth Editionperformance was distinctly rewarded, two-thirds of the students had no errors in making theircalculations.Does the experiment prove that economics students are rational? Why or why not? The experiment doesnot prove that economics students are rational, only that the rationality assumption predicts betterperformancewhen the incentive to make the right choice is higher than one that does not. Note that one-third of the students in the better-rewarded group did no better than did the majority of the uniformly paidgroup.Incentives and Childhood ObesityChildren who gain weight eat more calories than they use up each day. The ones who gain weight thefastest eat relatively more high-calorie foods such as hamburgers, French fries, and other fast foods. Theyalso exercise less, preferring to spend more of their time watching TV and playing video games ratherthan playing out doors and participating in sports.Traditionally, mothers have taken responsibility for making the choices about what foods children eat andthe scope of their outdoor activities. As compared to the 1960s, when about one-half of mothers workedoutside the home,more thanthree-fourths do so today. These mothers have less time to keep theirchildren fromeating too much, e.g.,in the hours after school before getting home from work, and to take themto playgroundsto exercise. This helps explain why only 8 percent of children whose mothers have neverworked outsidethe home are obese as compared to 17 percent among children whose mothers work full-time. It is importantto realize that children have always had an incentive to eat sweet snacks and tastyhigh-calorie foods andengage in sedentary activities; it is now also true that parents have economicincentives that affect the choicesthey make that affect the time available to devote to child rearing. Finally,our society has developed a taste for bigger houses with more expensive furnishings and bigger, moreexpensive cars.From an economic standpoint, is it possible that some parents effectively make a choice to have bigger,more expensive houses, cars, furnishings, and overweight children? (Hint:To be able to purchase bigger,more expensive houses, cars, and furnishings, parents must spend more time earning incomes and lesstime rearing their children.) Yes. By making the decision to have bigger houses and cars and moreexpensive furnishings, some parents are also choosing to supervise their children’s eating habits andactivities less. Thus,they are choosing to let their children become obese.Incentives and the InternetIt is worth examining the idea that changes in incentives cause people to change their behavior. In recentyears, the cost of some types of high-speed Internet service has declined to as little as $20 per month forunlimited access to the Internet. This means that people who use their high-speed connection primarilyforsurfing the Web for information and e-mail pay exactly the same amount per month as do gamers andpeoplewho download music and videos. The first group uses very little bandwidth, and the second groupuses veryhigh amounts of bandwidth. Recently, some Internet service providers (ISPs) have put forth theidea that the monthly fee for high-speedInternet service be for a specific amount of bandwidth use. Afterthat bandwidth has been used by a customer,a feewould bechargedon additional bandwidth use. What doyou expectthis form of pricing by ISPs for bandwidthwoulddoto the volume of videoand musicdownloadsfromcompanies such as iTunes and companies that provide movies over the Internet? Thevolume of such downloads and thussales of high bandwidth applications would decrease because the priceof each additional downloaded movieor song would go from being essentially free under the currentpricing scheme to having a positive price after the initial amount of bandwidth sold with the Internetservice had been used.
Page 6 of 31
Solution Manual for Economics Today The Macro View, 20th Edition - Page 6 preview imageLecture Extender Examples491Getting DirectionsSuppose that you plan to take a trip from San Diego to San Francisco and you have never made this tripbefore. You could use Google Mapsand it wouldtell you to get on Interstate 5 going north until you getto San Francisco. Alternatively, suppose that you want to get to a specific address in San Francisco. Inthis case, Google would give you a map that tells you to get on Interstate 5 going north until you get toSan Francisco. At this point, it would give you the freeway exit number needed and a detailed street mapthat would allow you to drive to the address you have chosen.How does a map resemble a model and the realism necessary of that model? A model should capture onlythe essential relationships that are necessary to analyze a problem at hand. Thus in the first case of gettingfrom San Francisco to San Diego, a very simplemap (model) that has almost no detail is adequate foryour purpose. In the second case, considerably more detail (more realistic) is required.Chapter 2Scarcity and the World of Trade-OffsWhy Today’s College Bands Get Less Playing TimeAt a college basketball game with only 25 seconds left, the home team, which is behind by 1 point,steals the ball and calls time-out. As the home team’s band director gets ready to play part of the school’sfight song to get the fans fired up behind the team, she gets a message over her headset telling her thatthere is one more commercial to do before the game ends. As the scoreboard flashes the name of a localbank, the gym’s 110-decibel sound system blares out a prerecorded voice describing the bank’s lowinterest rate loans and top-notch customer service. The commercial then ends just before the play begins.Across the nation, college athletic departments have found that they can charge up to $15,000 per minuteto advertisers for a commercial played to the fans at the arena. Thus,many bands find that they are gettingto play lesseven in 15-second segments called “shorts”because even 15-second commercial timeslots can be sold to advertisers. If the average minute of time at a college game can be sold for $10,000in advertising revenues, what is the opportunity cost to the college of a 15-second band “short?” Fifteenseconds is one-fourth of a minute. Thus,the opportunity cost of a 15-second “short” is one-fourth of$10,000 or $2,500.The ControversyoverOffshore Drilling as a Reaction toHigher Gasoline PricesIn 2008, the price of gasoline rose to over $4.00 per gallon,and diesel climbed tomore than$5.00 pergallon. At the same time there was a presidential election in which this development became one of themajor issues. The Republicans favored rescinding a ban on offshore drilling for oil in most waters aroundthe United States except for the Gulf of Mexico, while the Democrats largely opposed lifting themoratorium.According to the Federal Energy Information Administration,an estimated 18 billion barrelsof oil in the areaarecovered by the moratorium.What is the opportunity cost to the economy of a decision to prohibit offshore drilling for oil? Theopportunity cost to the economy is the 18 billion barrels of oil.Continued Life versus the EnvironmentIn the 1990s, it was discovered that taxol, a chemical found in the bark of Pacific yew trees in the PacificNorthwest, was effective in treating ovarian cancer, which afflicts 10,000 women each year. It takes thebark of about 150,000 yew trees per year to extract enough taxol to treat these women, many of whomwould otherwise die. The problem is that yew trees are slow growing and are mostly in old-growth foreststhat have taken hundreds of years to develop. Taxol has recently been found to be effective on a number
Page 7 of 31
Solution Manual for Economics Today The Macro View, 20th Edition - Page 7 preview image492MillerEconomics Today,Eighteenth Editionof other cancers, such as lung cancer. This has increased the demand for it and thus results in more treesbeing required. Even the development of a semisynthetic version of taxol does not completely solve theproblem. Complete synthesis is not yet economic. Environmentalists point out that heavy logging of old-growth forests can damage other trees and the environment, generally. Until scientists develop newsources of taxol, there will continue to be a trade-off:Savingwomen with ovarian cancer and personswith other types of cancer or saving Pacific yew trees.What is the opportunity cost of saving yew trees? What is the opportunity cost of saving the lives of thewomen suffering from ovarian cancer who could be treated with taxol? The opportunity cost of savingyew trees is the costs associated with the early death of women from ovarian cancer. The opportunity costof saving those lives is the loss of yew trees and damage to old-growth forests.Becausethe number ofPacific yew trees is finite and limited to a small area, the yew trees could become extinct.Do all environmentalist attempts at saving plants or animals involve an opportunity cost? Yes, allenvironmental attempts to save plants and animals involve an opportunity cost because resources mustbe used to save them or some resources may not be used if the plant or animal is to be saved. In all cases,resources have alternative uses. Those that are used to save a plant or animal cannot be used forsomething else. If a resource cannot be used so that a plant or animal can be preserved, then we must giveup the highest-valued alternative thing for which it could have been used.The Opportunity Cost of Going to CollegeWhat is the cost of going to college? The obvious costs are the costs of tuition, fees, and textbooks. Theobvious costs of going to college do not include room and board because these costs will be incurred nomatter what you dogo to work or go to school. The biggest cost of going to college is forgone income.This is to say that going to college usually means sacrificing a full-time salary. In the case of a typical18-year-old, the opportunity cost of going to college may be $15,000 to $20,000 per year. The cost to apop country singersuch asTaylor Swiftwould have beennearly$60millionthis year. ForJustin Bieber,it would have been $55million. For the successful musician, actor, or model, the old saw “Get all theeducation you can get” doesn’t make much sense.Opportunity cost has something to do with the decision byTaylor SwiftandJustin Biebernotto attendcollege while they are under the age of 25. Between the ages of 17 or 18 and 25,the opportunity cost ofgoing to college for stars in the popular music industry is very high.What is the opportunity cost of leaving college early for student athletes who join professional teams priorto graduation? The opportunity cost of leaving college early is the forgone education. If at the end of aprofessional career the athlete does not have a degree, then his or her best income alternatives will usuallybe much lower than for an athlete who did get a degree.Small-Business Entrepreneurs Create Most New Jobs for New WorkersSmall-business entrepreneur-headed companies employing 500 or fewer workers account for about99.7percent of all U.S. businesses and employ nearly half of U.S. workers. Entrepreneurs’ efforts tocreate new small enterprises or to expand existing businesses account for between 1 million and 3 millionnew jobs each year. As a consequence, the enterprise-establishing and business-expanding efforts ofentrepreneurs account for about 75 percent of the net increase in U.S. employment.Why do states with laws promoting entrepreneurial activity,such as Arizona, Colorado, and Oklahoma,typically experience the largest employment gains each year? Laws promoting entrepreneurial activitymust mean that these state governments make it easier and less costly to establish and operate a businessin these states. There is an incentive therefore for entrepreneurs to establish businesses and to expandexisting ones where it is less costly to do so.
Page 8 of 31
Solution Manual for Economics Today The Macro View, 20th Edition - Page 8 preview imageLecture Extender Examples493The Opportunity Cost of Time Stuck in TrafficEvery year motorists spend about 3.7 billion hours waiting in gridlocked traffic. Policymakers commonlyargue that the explicit cost of time spent in traffic jamsat least $6 billion spent on the $2.3 billion gallonsof fuel burned while engines idleis sufficiently high to justify building more highways. The implicitopportunity cost is much higher.The average U.S. worker earned about $24.5 per hour in 2012, so theimplicit opportunity cost of all those hours spent in traffic is around $91 billion per year. Thus the annualtotal social cost of U.S. traffic gridlock is more than $97 billion.Why do economists use the hourly wage to measure the opportunity cost of the time a person spends ingridlocked traffic? Because that is the market value of a person’s time, economists assume that this willbe the minimum value that a person will put on alternative uses his/her time, or he/she would choose towork.Chapter 3Demand and SupplyCongestion Pricing for San FranciscoSan Franciscoandother citiesareexamining congestion pricing,whichhas been successfully used inEuropean and Asian cities,as a way to reduce traffic congestion. In London, for example, drivers wereinitially charged an $8 fee,whichhas since increased to $14,every time they enter London’s centralbusiness district. Before the congestion fee was implemented, traffic congestion was a major problem incentral London. The effect of the congestion fee was to reduce traffic congestion by nearly a third in threeyears, as measured by traffic speeds. Traffic speed has nearly doubled from about 5 mph during businessand rush hours to about 10 mph as a result of a decrease in the number of motor vehicles entering centralLondon. Use of public transportation into the area increased significantly after the fee went into effect.Does the decrease in the number of vehicles entering central London represent a decrease in demand ora decrease in quantity demanded for the use of central London’s streets? It is a decrease in the quantitydemanded because the price of using the streets has risen from $0 to $14. Thus,there has been amovement along the demand curve for the use of the streets for driving in a motor vehicle.U.S. Agricultural Subsidies and GlobalizationThe U.S. government began subsidizing U.S. cotton farmers in the twentieth century to allow them to stayin business. The purpose was to insulate them from fluctuating market prices that could bankrupt cottonfarmers as a result of world market conditions beyond their control. The farm lobby has made sure thatcotton remains a subsidized product, protecting to some extent cotton farmer income.Thecotton subsidiesof theUnited States (and other developed countries) are alleged to be a major reasonwhycotton farmers in India are experiencing declining income and many are being forced out offarming.The world price of cotton has fallen by more than 33 percent since the mid-1990s. The Indiansblame the United States and other developed countries’ subsidies for these lower prices. Thus,a programaimed at helping U.S. farmers is driving Indian farmers out of business.Are the Indian farmers right to blame the cotton subsidies for their plight? Yes. The United States anddeveloped country subsidies increase the world supply of cotton and decrease its price, other things heldconstant.
Page 9 of 31
Solution Manual for Economics Today The Macro View, 20th Edition - Page 9 preview image494MillerEconomics Today,Eighteenth EditionIs Dental Care BecominganInferior Good?A British health minister once claimed that the demand for health care is infinite because everyone is in alosing battle against death. This is not so for American dentistry, however. As aggregate U.S. income levelshave risen during the last 25 years, overall spending on dental care services has declined.It is not that fewer Americans are seeing dentists each year. They just do not require as many fillings orextractions. As incomes rose, people purchased more expensive and effective toothpastes. More towns,cities, and counties began to fluoridate their water as the relative price of this anticavity agent declined,so changing relative prices have played a role. The higher incomes of their residents have permitted moremunicipalities to purchase fluoridation systems. At every age, the average American now has two moreteeth than 25 years ago.Many fledgling dentists have begun specializing in “cosmetic dentistry” desired by clients with healthybut less than beautiful teeth. Compared to traditional dental-care services, is cosmetic dentistry more orless likely to be a normal good? Cosmetic dentistry is more likely to be a normal good. As incomes rise,people are likely to wish to improve their appearance because they can afford the expense.The Global Financial Crisis and the Price of OilIn the summer of 2008, the price of oil reached a peak of $147 a barrel, with gasoline reachingmore than$4.00per gallon in much of the United States. The global financial crisis struck in September 2008, whichusheredin a worldwide recession. The price of oil fell to below $60 per barrel,and gasoline fell to lessthan $2.00 per gallon in much of the United States. Recessions result in large numbers of people losingjobs and thus having reduced incomes. Do oil and gasoline appear to be normal goods? The demand for anormal good will increase when buyer income increases and decrease when buyer income decreases.Becausea recession means lower buyer income, the decrease in the prices of oil and gasoline would bedue to a decrease in demand caused by a decrease in income,ceteris paribus.Thus,oil and gasoline arenormal goods.Brunettes Now Have More FunIn the 1960s, manufacturers of hair dye aired TV commercials claiming that “Blondes Have More Fun” and“Gentlemen Prefer Blondes.” For years thereafter, purchases of blonde hair colorings were a significantlyhigher share of total U.S. dye purchases. In the early 2000s, women’s tastes began to change. More topfemale stars of stage and screen are brunettes. In addition, the numbers of Asian, Hispanic, and Arabicwomen,who are largely brunettes,has increased. Finally, graying women in the aging Baby Boomergeneration find that darker colors cover graybetterand require less maintenance.What do you suppose has happened to the demand for brunette hair dyes in the 2000s? What about thedemand for blonde hair dyes? As tastes have moved in favor of brunette hair, the demand for brunette hairdyes has increased. As tastes have moved against blond hair dyes,the demand for blonde hair dyes hasdecreased.Thai Gadget Makers Raise Production When LCD Prices FallBeginning in 2004, the prices of liquid crystal displays (LCDs), which are key components in manyelectronic devices, fell significantly. As LCD prices fell,Thailand-based manufacturers of electronicdevices,such as cell phones, hand-held computers, portable DVD players, and laptop computers that alluse LCDs,increased production.What do you think happened to the prices of these devices that use LCDs? Why? The lower price of animportant input such as LCDs would have increased the supply of these devices.Ceteris paribus,theprice of each device would have decreased.
Page 10 of 31
Solution Manual for Economics Today The Macro View, 20th Edition - Page 10 preview imageLecture Extender Examples495Chapter 4Extensions of Demand and Supply AnalysisOPEC and Oil PricesIn July 2008, the price of oil increased to $147 per barrel. By October, it had fallen to around $60 perbarrel. OPEC saw the price of their major export, oil, decrease by 60 percent in a few months. During thatperiod the OPEC countries cut production by a littlemore than2 million barrels per day. By mid-November, the price had fallen below $60 per day. OPEC announced in November that it would cutproduction again if the price did not stabilize at a reasonable level of $70 to $90 per barrel.Assuming that OPEC decreased the supply of oil bymore than2 million barrels per day over a two-month period, why would the price of oil continue to fall? The demand for oil must have been decreasingfaster than supply was decreasing.Jamaica’s Sugar Industry Takes a HitSugar production in Jamaica amounts to a littlemore thana third of the country’s exports. The countrycould sell its sugar in the European Union (EU) at a price three times higher than the world market price.Under an agreement reached with the World Trade Organizationin 2009, the EU agreed to cut the sugarsubsidy by 36 percent over the next four years. The result is an expected price that would seriously harmJamaican sugar producers who are not competitive at the world market price of sugar.Using the supply and demand model, explain how the reduction in the EU sugar subsidy would affect theprice of sugar paid to the Jamaicans. The effect of the subsidy is to increase the supply of sugar producedby Jamaican producers. The EU would decrease the subsidy paid to Jamaican producers,and the effectwould be the same as a decrease in the price received by them for their sugar. The supply of Jamaican-produced sugar would decrease,and the price would decrease, other things, constant.Why Ships Face Traffic JamsIn most U.S. ports, docking fees, which are fees charged to ship owners for the right to dock and load andunload passengers or freight, are set by government agencies. In recent years, the demand for dockingspace at U.S. seaports has increased as the number of cruise ships and number of pleasure cruises haveincreased.Neither theprices charged to dock a ship nor the amount of docking spacehave changed asdemand has increased. What kind of price control has been placed on docking space for ships? A priceceiling that does not respond to changes in demand has been imposed.What effect do you expect the price ceiling combined with an increase in demand for dock space has had?A shortage of docking space has developed because the price space for docking a ship has not risen to themarket-clearing level.Movements in Supply and DemandIt’s not often that a doubling of demand leads to a 25 percent reduction in price. That is exactly whathappened in the underwater fiber-optic cable business. This is a perfect classroom example.The demandfor underwater fiber optic cablesdoubled in 2003 and continued to grow in 2004 and 2005.In contrast, rates of capacity utilizationin the undersea fiber-optic business have hovered around 10 to15percent during the first half of the 2000s.Consequently, fiber-optic cable owners were willing to reduceprices quite substantially in order to “light up” some “dark” fiber-optic cable capacity. That is to say,supply could move out to the right almost at will in that industry.
Page 11 of 31
Solution Manual for Economics Today The Macro View, 20th Edition - Page 11 preview image496MillerEconomics Today,Eighteenth EditionThis is a good example of showing the supply curve moving outward faster than the demand curve movedoutward. Given that the demand doubled and prices fell by 25 percent, you can demonstrate this with arelatively large shift in the supply of undersea fiber-optic cable utilization.Profiting by Lowering the Transaction Costs of Junking ComputersHaving a computer that is so out-of-date that it cannot be adapted or at least easily adapted to modernsoftware can create problems for its owner. Most states have laws against throwing computers awaybecause they contain toxic metals and other potentially harmful sources of pollution. As a result, for feesranging from a few to $50 or more,middlemenwill take old computers and refurbish the ones that can beupgraded for resale and break the others down for parts that can be resold. In thisway middlemen profitfrom reducing transactions costs for consumers faced with discarding old computers.What would happen to the demand for the services of computer-recycling middlemen if computermanufacturers found a way to produce computers without pollution-causing components? The demand fortheir services would decrease (possibly to zero) because it would be possible to simply throw away anobsolete computer at no cost to the owner.Preventing Price Gouging Promotes Black Markets in FloridaIn many states, including Florida, it is illegal to engage in price gouging. Florida’s law penalizes a sellerfor any “gross disparity between the quoted price of a ‘necessity item’ such as water, and the item’s priceon the date that the governor declares a state of emergency.” The penalties stay in force for 30 days fromthe date of the declaration. Florida is susceptible to hurricanes,and in 2004, three successive hurricanesstruck Florida. The demand for “necessities,” such as bottled water, gasoline, and plywood increasedsignificantlybecausedamages to the state’s housing, electrical grid, and businesses were extensive. Withprices fixed at prehurricane levels, there was little incentive for producers and others outside the state torush these items totheFlorida disaster areas.Who gains and who loses when antigouging laws contribute to shortages of items such as bottled water orplywood? The buyers who are able to buy water and plywood at below market-clearing prices gain by nothaving to pay the market-clearing price. Those buyers who are unable to buy water and plywood atcurrent prices and who would be willing to pay the market-clearing price lose because the market doesnotsupply enough of these goods at the antigouging price (ceiling price). Sellers lose because they earnlower profits than they could have made by selling more of these goods at a higher price.Price Controls in Sierra LeoneLisa Walker spent a year in Sierra Leone, West Africa, as a Peace Corps volunteer, and she kept a diaryofher experiences. One thing she wrote about was what happened when the government imposed pricecontrols on many common items. “For the past 5 days,” she wrote, “nobody has sold cigarettes, kerosene,Maggi (bouillon) cubes, or rice here . . . This is the result of the government’s new order. The governmentsays the Maggi cubes have to be sold for 30 cents, but the sellers bought them for 50 cents, so whenmilitary men enter the village to enforce the government price, those with Maggis hide them. It is thesame story for cigarettes and kerosene. The rice supplies are hidden because of government prices. Unlessone is willing to pay an outrageous price, it is impossible to buy rice in the marketplace. The only way toget rice legallyis to buy it from the government. This means standing in long lines for many hours to get arationed amount. I don’t know how Sierra Leoneans are managing or how long this artificial shortage willlast.”How would you graphically illustrate the market for rice in Sierra Leone in the presence of price controls?The supply of rice would become vertical at the price ceiling and quantity supplied by the government.
Page 12 of 31
Solution Manual for Economics Today The Macro View, 20th Edition - Page 12 preview imageLecture Extender Examples497There would be a shortage at the legal price. The equilibrium price would occur at the intersection of thedemand curve and the vertical portion of the supply curve.Should the Legal Quantity of Cigarettes Be Set at Zero?Nicotine has been used as a psychoactive drug by the native peoples of the Americas for approximately8,000 years. Five hundred years ago, Christopher Columbus introduced tobacco to Europeans, whodiscovered, once they overcame the nausea and dizziness produced by snorting, chewing, and smokingit, they simply could not get along without it. Nicotine rapidly joined alcohol and caffeine as one of theworld’s most popular psychoactive drugs. In the century after Columbus returned from the Americas withtobacco, consumption and addiction to nicotine spread rapidly around the world. There followednumerous attempts by governments to quash what had come to be called the “evil weed.” None weresuccessful, even in Russia where a smoker could be executed for using it. A few years ago, the head ofthe Food and Drug Administration announced that his agency had concluded that nicotine is addictive andshould be classified with marijuana, heroin, and cocaine.What can we predict if tobacco is ever completely prohibited? Because tobacco is now legal, the supplyof illegal tobacco is zero. If the use of tobacco were prohibited, the legal supply in the United Stateswould become zero. Even if all of those who had been producing tobacco legally went out of business,firms in foreign countries would increase production to meet U.S. demand. The supply curve of illegaltobacco products would shift to the right. There would be an illegal tobacco demand curve from U.S.users of tobacco. The price people would pay would go up.What other goods or services follow the same analysis as the ones presented here? The psychoactivedrugs such as marijuana and cocaine were all legal around the turn of the century. The illegal supply waszero. When these drugs were outlawed, that is, the legal supply was setat zero, illegal demand developed,and the illegal supply increased. The price of these psychoactive drugs increased. The same analysis canbe applied to prostitution and gambling services.Chapter 5Public Spending and Public ChoiceTrying to Lay Claim toTrees That Sop Up PollutionAmerican Electric Power (AEP) owns power plants around the United States that together release about3 percent of U.S. CO2emissions every year. The company has entered into a voluntary agreement withthe U.S. government to cut its CO2emissions by 1 percent every year. AEP has determined that it wouldcost between $50 and $75 per ton of eliminated emissions to build cleaner power plants. In contrast,planting a sufficient number of CO2absorbing trees would cost only $1 to $2 per ton of emissions.AEP faces two problems in utilizing trees to reduce the polluting effects of its power plants. One isuncertainty about how much CO2trees absorb from the air. The company has already spent more than$17 million to reforest nearly 60,000 acres of land near its U.S. power plants and paid more than$7 million toprotect a 4-million acre forest in Bolivia. AEP projects that over several decades, the newU.S. trees alone will sop up 11 million tons of CO2or the amount that its power plants release in 16 months.Independent and government scientists disagree, however, about whether these estimates are accurate.The second problem is that property rights to CO2tree absorptions are poorly defined. It is unclear, forinstance, how much pollution-reducing credit AEP will be able to claim from its investment in Bolivianforests if Bolivian polluters try to also lay claim to the pollution abatement benefits those forests provide.Under what circumstances could society come out ahead if AEP and other polluters planted trees insteadof cleaning up any of their power plants? If companies could have ownership rights to the trees they
Page 13 of 31
Solution Manual for Economics Today The Macro View, 20th Edition - Page 13 preview image498MillerEconomics Today,Eighteenth Editionplanted, they would plant the trees because fewer resources would be used to clean up air pollution. Theseresourcescould instead be used to produce other goods and services. The external costs of pollutioncould beinternalized at minimum cost. Also,there would be an increase in the quantity of woodproduced.The Global Financial CrisisIn 2008, the Federal Reserve lowered interest rates and the federal government implemented a tax rebateprogram as the U.S. economy began to show signs of entering a recession. Later in the year, the FederalReserve provided very large amounts of money to the financial markets and banking system as thefinancial markets began to collapse, to prevent a much more serious recession or depression fromdeveloping.Which function of government was the Federal Reserve and the federal government performing? The FederalReserve and federal government were performing the function of ensuring economy-wide stability, whichincludes preventing recessions to ensure full employment and to promote economic growth.Hydrogen-Based Fuel CellsIn his State of the Union address in 2003, President Bush supported the idea of changing from the use ofinternal combustion engines to fuel cells based on hydrogen as a way of reducing air pollution and theemission of greenhouse gases. Fuel cells are nonpolluting because they only emit water vapor. PresidentBush proposed having the government subsidize research and development of hydrogen fuel and fuel celltechnology. The president did not propose raising taxes on gasoline as a way of encouraging the use offuel cells and reducing greenhouse gases.Would an increase in the tax on gasoline encourage the development of hydrogen-based fuel cell technologyfor automobiles? A tax that accounted for all external costs associated with gasoline emissions wouldincrease the price of gasoline and make operating a gasoline-powered car more expensive. Thus,therewould be an incentive for auto companies to develop and sell fuel cellpowered cars because consumerswould find these cars relatively cheaper to operate. The demand for fuel cellpowered cars wouldincrease and the demand for gasoline-powered cars would decrease.Office of Homeland SecurityAfter the events of September 11, 2001, an Office of Homeland Security was set up to try to coordinatetheantiterrorism efforts of various agencies of the federal government. In 2002, the Homeland Security Actwaspassed, creating the Department of Homeland Security. Two components of the mission of theDepartment of Homeland Securityasset forth in the act are to “prevent terrorist attacks within the UnitedStates and toreduce the vulnerability of the United States to terrorism.” The department evaluatesintelligence concerningpotential terrorist threats and issues alerts when the danger of terrorist attacksappears to be imminent. In addition, it works with law enforcement and emergency service agencies in thestates and cities to help prepare for terrorist threats.Does the part of the mission of the Department of Homeland Security identified above describe theprovisionof a public good? The part of the mission identified appears to be a public good. First, it is a non-rival good.The use of it by one person does not decrease the availability of it to another person. Also, it issubject to the exclusion principle, i.e., once it is produced, no one can be excluded from enjoying itsbenefits, even if they do not pay for it. It is indivisible and would be difficult to price based on how mucha person uses it.
Page 14 of 31
Solution Manual for Economics Today The Macro View, 20th Edition - Page 14 preview imageLecture Extender Examples499Private Property Rights in ChinaIn 1949, China officially became a “People’s Republic” in which all resources were owned by thegovernment. For nearly 30 years, the Chinese government made all decisions concerning the productionand distribution of goods and services. Beginning in the 1980s, the Chinese government embarked on agradual program of business privatization. This policy resulted in an increase in economic growth.Nevertheless, government and business leaders eventually recognized that China’s economy would beunable to obtain its full potential in the absence of a formal declaration of private property rights. Anamendment to the Chinese constitution officially guaranteeing the right to private property was adopted in2004. How might the establishment of private property rights have contributed to a burst of Chineseeconomic growth in the past few years? (Hint:Why might clearer rules about resource ownership makepeople more willing to start businesses?) Once property rights were established, entrepreneurs knew thattheir right to possess, use, enjoy the benefits of its use, and transfer of their property would be protectedby the government.This assurance provided an incentive to start businesses. For those who had been running businesses, aswell as new entrepreneurs, the establishment of private property rights would have provided an incentiveto use their property efficiently. The effect would be to cause the establishment of more businesses andencourage efficiency. The output of goods and services would be predicted to increase faster.Microsoft Antitrust SuitIn 2002, a four-year-long lawsuit against Microsoft by the Department of Justice was settled. The Departmentof Justice alleged that Microsoft had illegally maintained a monopoly in the operating systems market andhad used that monopoly to attempt to monopolize the Internet browser market by tying purchases ofInternet Explorer to purchases of the Windows operating system. The company was found by the court tohave illegally maintained its virtual monopoly over computer operating systems and to have attempted tomonopolize the browser market. Microsoft agreed to no longer engage in its restrictive business practices.Which economic function of government was being performed in this example? Are there any benefits tothe economy from the settlement of this case? The economic function of government being performed inthis case is promoting competition. By preventing Microsoft from continuing to maintain its monopoly ofPC operating systems and attempting to monopolize the browser market, the government hoped toincrease efficiency in the market for operating systems and to prevent the loss of efficiency in the browsermarket.Canada Opts Out of Paying for North American Missile DefenseThe North American Aerospace Defense (NORAD) systemusessatellitesandground-and air-basedradar systems to detect attacks aimed at the United States and Canada. In the past, both countries paid forthe operationof NORAD. When the United States asked Canada to help finance a new missile defense systemthat would supplement NORAD’s activities, the Canadian government declined in part because the proposalwas politically unpopularwith Canadians.They become public goods because the principle of rival consumption does not apply to them. Thus,itbecomes possible to be a free rider because if the defense system is provided at all, then a country thatdoes not pay for it can still be protected.Property Rights Resolve the Airport Wi-Fi SpilloverTo encourage U.S. travelers to use their facilities, various U.S. airports have installed Wi-Fi systems thatallow travelers to use Blackberries and laptops to access the Internet and e-mail accounts. Several airlineshad set up their own wireless communication systems to process passenger tickets and to track luggagebefore the airports had installed their WI-Fi systems. When the airport Wi-Fi systems started operating,their
Page 15 of 31
Solution Manual for Economics Today The Macro View, 20th Edition - Page 15 preview image500MillerEconomics Today,Eighteenth Editionradio signals interfered with some of the airlineswireless communications systems,causing ticketing andbaggage data transmissions to be garbled or blocked. At the same time,transmissions from the airlines’wireless systems had the same effect on the airportsWi-Fi systems. Under the airlinescontract with theairports, the airports had the right to use the frequencies on which conflicts had arisen. Thus,the airlineshad to incur the costs to recalibrate or replace their systems entirely to eliminate wavelength “pollution”created by competing systems.Why is it that an external cost would be created if transmissions from a company’s Wi-Fi system garbledthe signals of the wireless computer networks in a nearby residential neighborhood? In the process ofusing its Wi-Fi system, the company is imposing uncompensated costs on the wireless computer networksin the nearby neighborhood. In effect, the company’s “electronic pollution” spills over and makes theother wireless computer networks useless.Chapter 6Funding the Public SectorHow State Trucking Fees Push Up Highway Maintenance CostsOregon is the only state that bases highway fees charged to truckers on the amount of weight carried pertruck axle. Having more axles better distributes cargo weight and reduces pressure on the highway,minimizingwear and tear on the roads. Thus,Oregon’s system of highway fees gives truckers who haulfreight only within Oregon an incentive to drive trucks with more axles, thereby reducing damage to thestate’s roads and helping hold down state highway spending. In contrast, every other state bases highwayfees on a truck’s fuel consumption. Driving trucks with fewer axles reduces tire friction on the roadsurface, which increases fuel efficiency and thereby reduces the fees truckers must pay to use highways.Naturally, freight haulers in states outside of Oregon have an incentive to drive trucks with fewer axles.As a result, roads in these states suffer greater damage, which in turn, ultimately generates more spendingon highway maintenance.If a trucking firm based in Oregon sends most of its trucks on long-distance trips outside the state, is itmore likely to use trucks with four or five axles? The Oregon trucking company would use trucks withfour axles because they would pay most of their taxes and fees on fuel. Their fuel costs and total costswould thus be lower.States Seek to Tax Internet SalesAccording to the National Governors Association (NGA), failure to collect sales tax on online salesresults in annual tax revenue losses of at least $35 billion. State governments are unable to apply sales taxrates to most Internet orders for out-of-state goods and services, but this has not stopped them from tryingto do so after the fact. Twenty state income tax forms now have a line on which taxpayers are supposed toreport sales taxes owed on out-of-state purchases. To get people to report out-of-state purchases, statesthreaten audits that would uncover credit card records.Why do you suppose that most states with lines on tax forms that require taxpayers to report taxes due onout-of-state purchases do not audit every taxpayer who chooses to leave the line blank? (Hint:Engagingin any activity, including conducting audits of taxpayers entails an opportunity cost.) It is most likely thatmost taxpayers who leave the line blank have no tax to report, or at best only a small amount that can beproved. The tax revenue return from auditing all of these returns would require a large expenditure ofstate revenues that could be used for higher priorities.
Page 16 of 31
Solution Manual for Economics Today The Macro View, 20th Edition - Page 16 preview imageLecture Extender Examples501Eastern Europe Discovers Proportional TaxationIn most nations, income tax systems are progressive. Nevertheless, governments in several Eastern Europeannations have recently opted for proportional taxation. Most of these nations were formerly part of the SovietUnion, such as Russia and Estonia, or were satellites, such as Romania. Beginning in the mid-1990s, thegovernments of Estonia, Lithuania, and Latvia introduced tax systems that apply the same income tax rateto all levels of income. The Russian government established a proportional income tax system in 2001.Since then, the governments of Serbia, Ukraine, Slovakia, Georgia, and Romania have followed suit.What is true of average and marginal tax rates in Eastern European countries that have adoptedproportional income tax systems? The marginal and average tax rates are equal.Paying for Social Security via a Broadened Payroll TaxProfessionals such as doctors and lawyers who are self-employed pay a Social Security payroll tax rate of15.3percent on the first $113,700 of income or $17,396in Social Security tax. If one of them earnedmore than $113,700, the tax on the additional income would be zero. Recently, there have been proposalsto help solve the long-term funding problem in Social Security by charging the tax on all earned income.As an example, suppose a lawyer made $1,000,000 per year. Currently, she would pay a maximumamount of $17,396in Social Security tax. Under the proposal to subject all earned income to SocialSecurity tax, she would pay $153,000 in tax.To avoid paying a higher tax bill, the lawyer could establish an “S corporation” and work for it as anemployee. She could pay herself a salary of $113,700and limit her Social Security tax to $17,396. Therest of her annual income would be reported in the form of corporate profits. Based on current tax laws,she would have to pay income tax on her salary and the corporate profit, but the corporate profit is notsubject to Social Security tax.Does it matter for estimating the actual increase in the Social Security tax actually collected whether staticor dynamic tax analysis is used? Yes. Static analysis simply takes the higher Social Security tax rate andmultiplies it by the amount of earned income that currently is above the maximum subject to tax, i.e.,onthe tax base, to determine the estimated tax revenue to the government. Dynamic tax analysis takes intoaccount the existence of “S corporations” and the ability of self-employed persons with high incomes totake advantage of them to avoid the higher Social Security tax payments, i.e.,to shrink the tax base.Chapter 7The Macroeconomy: Unemployment, Inflation,and DeflationThe Nobel Prize for Economics and the Natural Unemployment RateThe winner of the Nobel Prize for economics in 2006 was Edmund Phelps, who developed the concept ofthe natural rate of unemployment. His original argument was that the economy will not reach equilibriumuntil the rate of unemployment reaches its “natural rate.” This natural rate means a rate of unemploymentin which all long-run forces work themselves out in the economy and it is in long-run equilibrium.Specifically,Phelps was concerned with the role of inflationary expectations and that these will eventuallycoincide withthe actual rate of inflation. The idea is that there is a rate of unemployment that is in effectan equilibriumrate toward which the economy tends to move. It is not, however, a fixed rate that holds forall time. Phelpsargued that the natural rate of unemployment would depend on different factors indifferent economies.
Page 17 of 31
Solution Manual for Economics Today The Macro View, 20th Edition - Page 17 preview image502MillerEconomics Today,Eighteenth EditionHow is the natural rate of unemployment related to the concept of full employment? The natural rate ofunemployment is full employment that exists when there is no cyclical unemployment. It is the rate ofunemployment that is the sum of structural and frictional rates of unemployment.Are a Self-Employed Dad and a Daughter Who Is Not WorkingPart of the Labor Force?Johnson is a self-employed painter. On most days,he paints room interiors alone. From time to time,however, he has taken on exterior house-painting jobs, which pay implicitly higher hourly rates.Whenever he has tackled home exteriors, he has usually hired his daughter, who will be 18 years old nextweek, to help after school. Johnson has not landed an exterior painting job in a couple of months, so hehas not required his daughter’s assistance during that time.Johnson is hoping to expand his thriving painting business into a larger operation. To learn more abouthow to function in the business world,he is taking business courses at the local community college in theevenings. Currently, he is enrolled in a course in principles of macroeconomics, and his class has justdiscussed how the labor force and the unemployment rate are measured. Now Johnson is wonderingwhether his daughter is technically part of the labor force but unemployed. She just graduated from highschool and had been actively looking for a job until about a week ago, when she gave up looking anyfurther. In fact, Johnson is not even certain whetherhe,as an actively self-employed individual, is currentlyincluded as an employed member of the labor force.IsJohnson’s daughter currently part of the labor force but unemployed?No. While she does not have ajob, she stopped looking for a job last week. Thus,she is not officially unemployed.Is Johnson currently part of the labor force and employed? Yes. As an actively self-employed individualhe is part of the labor force. He has a “thriving painting business.” He must therefore be employed.How the Word “Unemployment” Found Its MeaningUntil the late nineteenth century, people in the United States were not acquainted with the word“unemployment.” The failure of able-bodied people to find work in a largely agricultural country withso much plentiful land was usually regarded as an indication of laziness, not misfortune. During theboomingindustrialization of the latter half of the nineteenth century, about one-half of the native-bornpopulation andnearly all immigrants got jobs in manufacturing and transportation industries. Then a financialpanic in 1873generated thousands of business failures, and many thousands of workers found themselveswithout gainfulemployment.Statisticians conducting the 1878 census in Massachusetts decided that they had to come up with a categoryfor all the people who had become jobless so abruptly. They settled on the term “unemployment,” whichthey ultimately defined as working-age individuals “out of work and seeking it”the same definitionused today.Would unemployment as we understand it exist today if everyone was self-employed? No. A personcould be out of work due to decreases in demand for the product he/she used to make. The person couldnot be seeking a job in the modern sense because by definition no one would be hiring.Recessions and the Electoral Blame GameAs a result of the recession that began in 2007 and continued into 2009, the unemployment rate rose to ashigh as 10 percent. By the time of thepresidential andcongressional elections of2012, the economicrecovery was under way,but the unemployment rate was still around8percent. The Republicans saw thisas evidence that the Democrats’ economic policies had failed to deal with the lasting effects of the
Page 18 of 31
Solution Manual for Economics Today The Macro View, 20th Edition - Page 18 preview imageLecture Extender Examples503recession. They, in fact, blamed the lasting high unemployment on the policies of the Democrats andPresident Barack Obama.The Democrats and President Obama pointed to increasing realgross domestic product (GDP) as evidencethat the economy was fundamentally sound and was no longer in a recession. Both parties could not berighteither the economy had entered a period of expansion and the policies of the Democrats wereworking and they should get credit for it (whether deserved or not), or had notbuthad in fact contributedto continuing high unemployment.Why do you suppose that one party can at the same time be blamed for not really ending a recession and itselftake credit for ending a recession? The actual change in economic activity from a recession to an expansion(or vice versa) involves changes in a large number of variables from negative to positive. The Democratswere correct in stating that an expansion was under way. However, the fact that the unemployment ratedropped only slightlyfrom its highest point in the recession supported the notion that the Democrats’economicpolicies were ineffective in dealing with unemployment as measured by the unemployment rate.Thus whileconcentration on one or two measures of economic activity by one party will not definitivelyidentify the beginning of a recession or expansion, it can be effective politically. For example, despite anincrease in total employment,the unemployment rate may not change because of an unexpected increasein re-entrants and new entrants to the labor force,as was the case in2012.Deflation and Real Interest Rates in JapanAround the turn of the century, wholesale and consumer prices fell in Japan. In 2002, for example,consumer prices fell by 0.4 percent. Short-term interest rates averaged around 0.1 percent. Assumingthat the 0.4 percent decrease in the price level was anticipated in Japan, the real interest rate was at0.5 percent. This is computed by adding the expected rate of deflation to the nominal interest rate.Why can’t nominal interest rates be negative? A negative nominal interest rate implies that a lender willpay a borrower to borrow money. A lender could choose not to lend and have more wealth at the end ofany time period by not lending. His or her consumption and thus satisfaction would be higher.How Reliable Is the CPI?The CPI is a fixed-quantity price index, meaning that each month the Bureau of Labor Statistics samplesonly prices rather than relative quantities purchased by consumers. The problem is that when relativeprices of particular goods go up, consumers substitute in favor of other relatively less expensive items.When relative prices go down, consumers do the opposite. An important way that consumers deal withinflation is by buying less of products that become “too expensive.” The result is that the rate of inflationis overstated.Would there be a similar problem during a period of deflation? During a period of deflation,consumerswould substitute goods that experience a decrease in relative price for other relatively more expensiveones. Because a fixed-weight price index such as the CPI ignores this effect, it will understate the rate ofdeflation.Chapter 8Measuring the Economy’s PerformanceHow the Internet Has Contributed to a Lower U.S. Inventory-to-Sales RatioIn the 1990s, there was widespread adoption ofjust-in-time inventory techniquesby U.S. businesses,whichare techniques that companies use to keep inventories from running out or building up beyond desiredlevels. The Internet has facilitated the implementation of many just-in-time inventory techniques. When a
Page 19 of 31
Solution Manual for Economics Today The Macro View, 20th Edition - Page 19 preview image504MillerEconomics Today,Eighteenth Editioncompany that supplies basic components used in a variety of electronic products experiences an inventorybuildup, it has several options for reducing its inventory via the Internet. The company could offer someof its inventory for sale on organized business-to-business exchanges that handle total transactionsexceeding $1 trillion per year. In addition, it could use computer programs offered by Ariba andCommerce One to operate its own Internet auctions to sell its inventory to the highest bidders.Alternately, the company can purchase the Web-auction services of eBay or other firms to assist in sellingoff some of its inventory.Considerableevidenceshowsthat the use of the Internet-based just-in-time inventory techniques havecontributed to the noticeable decline in the ratio of inventories to sales in U.S. manufacturing. In 1990,the inventory-to-sales ratio was about 1.75, which means that U.S. companies had about $175 ininventory for every $100 in sales. Sixteen years later the ratio had fallen to 1.35.What effect would this decline in the inventory-to-sales ratio have had on U.S. inventory investment? Itwould have decreased the amount of inventory investment because the average firm would havedecreased its holdings of inventory by $40 for every $100 in sales in 2006 as compared to 1990.GDP and Economic WelfareGross domestic product, or GDP, has become the most important measure of how well the economyperforms. It is used by policymakers, economists, international agencies, and the media as the primarymeasure of a nation’s economic health and well-being, but it was not designed for this role. It is the sumof the value of final products and services produced in one year by domestic resources, with nodistinctions between transactions that add to well-being and those that diminish it. In the computation ofGDP,it is assumed that every monetary transaction involving the production and sale of final goods andservice adds to the nation’s well-being.GDP ignores everything that happens outside the realm of the production and market exchange of finalgoods and services, regardless of its importance to well-being.Would GDP increase when the environment is damaged by toxic spills and then the damage causedby these spills is cleaned up? Yes. The clean up of toxic sites would increase GDP because resourceswould be employed to clean it up. These resources would be providing final services to the economy.The productive activity that led to the spills would also be counted in GDP.Would the country actually have an increase in well-being as a result of the pollution and the clean upactivities? No. The pollution initially reduced well-being. Cleaning it up simply restored the environmentto its original state and the earlier level of well-being.GDP and Costa Rica’s Forestry ProductionMany developing countries depend on natural resources for much of their income and employment. Whena forest is cut down in Costa Rica, the output is sold, and if we look only at GDP figures, the economyappears to be growing richer. But what if the trees are not replaced so that their removal results inflooding, soil erosion, and loss of fuel and food by the indigenous population? Robert Repetoo of theWorld Resources Institute in Washington, D.C., has recalculated GDP in Costa Rica to reflect the impactof resource depletion. His figures show that within the forestry sector itself, net forestry productafterresource depletion is calculatedwas actually negative through most of the 1980s. Repetoo argues thatsuch statistics are important because they educate the developing countries and show them that theirnatural wealth is not limitless. He wants the United Nations to take into account the depletion of naturalresources when calculating each nation’s GDP. He points out that currently, a benefit from commercialforests is recorded only when trees are cut down.
Page 20 of 31
Solution Manual for Economics Today The Macro View, 20th Edition - Page 20 preview imageLecture Extender Examples505In the United States, there are actually more trees in our forests than there were 50 years ago. Does thismean that we should be adding to our GDP figures for this increase in our forests? We should not becounting these additional trees in current GDP. Using current definitions, trees in a forest are intermediategoods rather than final goodsbecausethetrees are not consumed as final goods until they are cut downand processed into forestry products that are in some final product.The Importance of Distinguishing Between Real GDP and Nominal GDPSuppose that you are advising a presidential candidate in an election campaign running against theincumbentpresident for the opposing party who points out that GDP has risen in every quarter since shehas been in office. The president is using this information to argue that that the voters should reelect herbecause her administration’s policies have led to prosperity for the last four years. You noticeduringtwoperiodsofher administration the unemployment rate rose significantly for several months. Theunemployment rate can increase while economic activity is increasing for a variety of reasons. Still, youwonder whether the candidate is talking about GDP figures that are adjusted for price level changes ornot.Would it be possible for nominal GDP to increase in every quarter of this president’s administration ifreal GDP decreases in some of them? Real GDP could have decreased and nominal GDP increased if thepricelevel increased by more than enough to offset the decline in real GDP. For example, if real GDP haddecreasedby 2 percent and the price level had increased by 5 percent, then nominal GDP would haveincreased by 3 percent.What the GDP Figures in China Really MeanFor years, the Western world has been regaled by impressive figures on the growth in the Chinese economy.Whereasthe United States has been happy with growth rates of 3 and 4 percent per year, the Chineseeconomyhas been growing at 7, 8, even 9 percent per year. But what do such statistics really mean? OneChinese economist in Beijing, Lu Feng, compared China’s official production rate of meat, eggs, and fishproducts with what people actually consumed. He concluded that real output in these sectors had beenexaggerated bymore than40 percent. The reason is that officials want to show good output performance,so they overstate agricultural output. The same problem plagues the industrial sector. The reality is that solong as China does not correct its reported output figures by doing many sampling surveys, it is bound toexaggerate its real GDP and thus its economic growth.Why do government statisticians in the United States not face a similar problem? In the United States,good performance by private producers is measured by profitability and not by total output. Thus,U.S.producers do not have any incentive to overstate output.Chapter 9Global Economic Growth and DevelopmentProductivity Growth in the United Statessince2002Productivity is the major driver of economic growth in the United States, accounting for about half of theincrease in real GDP over time. Between 1996 and 2001, productivity showed no trend and averagedabout 2.7 percent.In 2002, productivity increased to 4.1 percent and then declined to 1.0 percent by 2014.The average growth rate for productivity in this period was 1.9 percent.This development caused concernabout such factors as higher inflation and slower economic growth. If productivity continued to decrease,then the resulting slower rate of economic growth would mean smaller increases in real wages andstandards of living in the future.
Page 21 of 31
Solution Manual for Economics Today The Macro View, 20th Edition - Page 21 preview image506MillerEconomics Today,Eighteenth EditionBy how much more would output per labor hour and real GDP have increased in this six-year period ifproductivity growth had averaged 4 percent per year instead of 3 percent per year? (Hint:The productivitygrowth figures have been rounded off for use with Table 9-3.) If productivity growth had averaged 4 percentper year, output per labor hour would have increased by 27 percent. Real GDP would have increased byone-half of that amount or 13.5 percent, other things held constant. If productivity growth had averaged3 percent per year, output per labor hour would have increased by 19 percent. Real GDP would haveincreased by one-half of that amount, or 9.5 percent, other things held constant.Is Official Labor Productivity Overstated?According to the U.S. Bureau of Labor Statistics (BLS), U.S. labor productivity has increased bynearly40 percentsince 2000. To obtain the data used to create labor productivity measures, the BLS surveysbusinesses about their output of goods and services and the average weekly hours of full-time employees.When constructing its labor productivity measure, the BLS excludes government employees, self-employed people, managers, and part-time and temporary employees. Recent estimates indicate thatincluding these forms of labor might reduce the growth in U.S. labor productivity by as much as one-half.Why might the output of government workers be difficult to gauge for purposes of measuring laborproductivity? Government workers usually do not produce discrete units of output that are sold in themarket. Thus getting an output measure to divide by hours worked would be difficult or in some casesimpossible.The Productivity ParadoxIn the course of a book review he wrote in 1987, Nobel economist Robert Solow made the offhandcomment, “You can see the computer age everywhere but in the productivity statistics.” This commentsummed up what has become known as the “productivity paradox”: the seeming lack of productivitygains from information technologies. For example, widespread adoption of information technologies inservice industries was supposed to allow these industries to reap big efficiency gains. Bar coding ofmerchandise was supposed to allow sales clerks at retailers to do their work much more efficiently.Financial electronic data interchange was supposed to provide big productivity enhancements in financialservices. These productivity gains were slow to emergeeither that or the data are wrong.Higher education is a good example of a service industry. College campuses are now full of computers.How would you propose to measure the effect of computers on productivity in higher education?There are two places where it might be possible to measure productivity in higher education. One area isin administrative services, e.g., the registration process, student record keeping, payroll, etc., which aredone faster and with fewer person-hours than would be the case in the absence of computers. This isclearly the case with the advent of computerized test banks. At one time, departmental secretaries andother clerical personnel typed many, if not most, tests. Today, faculty members choose the questions asthey always did but have the computer generate the final copy of the test. Fewer clerical hours are used tosupport the teaching function. Insofar as the actual delivery of education by university faculty isconcerned, the use of semester credit-hours produced or number of students enrolled to measureproductivity (output per faculty member per hour in the classroom) probably is not an appropriatemeasure of education. On that basis, the only way for productivity to increase would be to increase classsize. Another way would be to measure how much additional learning occurs as a result of better teachingmaterials, student access to vast libraries on the Internet, skills acquired in using computers that betterprepare students for future careers, and more efficient methods of presenting material (presentationsoftware, for example).
Page 22 of 31
Solution Manual for Economics Today The Macro View, 20th Edition - Page 22 preview imageLecture Extender Examples507Economic Growth in China and India AcceleratesChina has per capita GDP levels that are well below those of the United States.The Chinese per capitaGDP in 2014 was $11,868 in 2014 dollars compared to the United States of $54,678 also in 2014 dollars.The Chinese growth rate of per capita GDP averaged 7.5 percent from 2000 to 2014, while that of theUnited States was 2.0 percent(source:data.un.org).Assume that China’s growth rate of per capita realGDP falls to 6 percent indefinitely. If the U.S. growth rate of per capita real GDP fell to 0 percent, howlong would it take China to catch up to the United States? (See Table 9-3.) Currently, U.S. per capita realGDP is4.6times larger than China’s. At a growth rate of 6 percent, $1 grows to $5.74 in 30 years. Thus,it would take China slightly more than 30 years to reach the current level of U.S. per capita real GDPeven if the United States stopped growing for that time period.Japan and Germany Save and Invest More Than the United States,But Does It Matter?Japan and Germany have saving rates that are substantially higher than the U.S. rate. As a result, theyhave accumulated more capital. On a per capita basis, Japan has about 22 percent more invested capitalthan the United States, and Germany has 13 percent more. Nevertheless, the United States creates morewealth per capita. In 2000 dollars,the United States created $29,950 in new wealth per capita, comparedto $23,600 for Japan and $23,600 for Germany.At least part of the difference results from more efficient use of capital in the United States. Economistsestimate that a unit of capital in Germany or Japan generates output that is about a third lower than that inthe United States. In other words, if a $1,000,000 factory produces 1,000,000 units of output per year inthe United States, a comparable factory would produce about 670,000 units of output per year in Germanyor Japan.Some claim that “Americans over consume, undersave, and underinvest.” How do the figures herecounter this statement? Americans get a return on investment in output terms that have the effect of a one-third increase in saving and investment as compared to Germany and Japan. On that basis, one cannot saythat Americans underinvest (and thus undersave) because the consequences of investment are greater herethan in Germany and Japan. On a comparative basis, the effect of Japan’s greater capital investmentpercapita is effectively 33 percent22 percent=11 percent less than in the United States, while Germany’sinvestment per capita is effectively 33 percent13 percent=20 percent less than in the United States.The Labor Productivity Boom in ManufacturingAmong the industries that manufacture physical goods, labor productivity has increased steadily over theyears. In many manufacturing industries, production tasks that once took two weeks and a dozen workersto finish now require only a few hours to complete. Since the 1950s, therefore, labor productivity has grownnearly three times faster than the rate of growth of productivity in the rest of the economy. Annual U.S.manufacturing output is five times higher than in the 1950s, even though total employment inmanufacturingabout 16 millionis the same as today.U.S. employment has more than doubled since the 1950s, so what happened to the percentage of workersemployed in manufacturing jobs? The percentage of workers employed in manufacturing jobs has decreasedbecause the number of persons employed has doubled. The same number of workers in manufacturing is asmaller percentage of total employment.Our High-Tech EconomyFour decades ago, one in six American businesses was automotive-related. In2012, autos and light trucksaccounted for about2percent of GDP. So does spending on computers and related equipment. Yet despitethe fact that technology’s share has doubled in the last decade, government statisticians still refuse to use
Page 23 of 31
Solution Manual for Economics Today The Macro View, 20th Edition - Page 23 preview image508MillerEconomics Today,Eighteenth Editionchip inventories and personal computer sales as economic indicators. The reason is that the economicwelfarecreated by high-tech industries is much harder to measure than, say, tons of steel or bushels ofcorn.When software is distributed at no charge on the Internet, does that result in an increase in GDP? Therewould be no effect on GDP because no market price is charged.Chapter 10Real GDP and the Price Level in the Long RunInvestment and Long-Run Aggregate Supply in the Great RecessionBetween the second quarter of 2006 and the second quarter of 2009, real gross private domestic investmentfell in all quarters except the second quarter of 2007 at an average annual rate of 11.5 percent. During thattime period, depreciation exceeded real Gross Private Domestic Investment (GPDI).What effect did having depreciation exceedingGPDIhave on U.S. long-run aggregate supply curve?Becausecapital was not being replaced, the capacity of the economy to produce goods and services wouldhave decreased. Thus,the long-run aggregate supply curve would have decreased.Regulation and Economic GrowthIf the extent of federal regulation activities in U.S. product and labor markets can be measured by thesheer volume of published regulations, then the scope of regulation has increased by more than 500 percentsince 1950. To satisfy heath and safety, environmental, labor, and various other regulations, companiesmust shift resources away from producing goods and services. Consequently, the regulation of economicactivities entails an opportunity cost for society: forgone production of real GDP.John Dawson of Appalachian State University and John Seater of North Carolina State University haveestimated the degree to which federal regulations have reduced real GDP growth. They have calculatedthat the trend rate of annual growth of real GDP is almost 1 percentage point lower due to regulatorygrowth. Thus if there had been no increase in federal regulations since the early 1950s, the economy’slong-run aggregate supply curve would have shifted muchfurtherto the right over the past five decades.U.S. real GDP would be at least 40 percent higher today.How do various activities involved in satisfying federal regulations get counted in real GDP?(Hint:Income payments must be made to owners of resources directed toward meeting regulatoryrequirements.) The value of the activities involved in satisfying federal regulations would increaseGDP since they generate income to the resource owners who supply the information. These costs areincluded in the prices of goods and services produced by the firms who are required to meet theregulations.The Financial Crisis, Long-Run Aggregate Supply and InflationIn the fall of 2008, the financial markets suffered a major crisis that led to a large decrease in the willingnessof banks and other financial institutions to lend either to each other or to consumers and businesses. Muchof the investment in capital in the United States is financed by borrowing. Many businesses were unableto borrow. Duringthis time, the capital stock decreased as worn-out capital was not replaced.What would the effect on the rate of inflation be if aggregate demand recovers to its prerecession level?The inflation rate would increase. During the recession,the decrease in the capital stock caused the long-run aggregate supply curve to shift to the left. Thus,the price level would increase to a higher level at thesame prerecession level of aggregate demand.
Page 24 of 31
Solution Manual for Economics Today The Macro View, 20th Edition - Page 24 preview imageLecture Extender Examples509Corporations Adjust to Potential and True DeflationFor decades, the conventional wisdom among corporate financial officers was that they could lower theircompanies’ costs by financing purchases of capital by borrowingtaking out loans from banks, sellingcommercial paper, issuing new bonds, and the like. The reason is that debt has traditionally been lessexpensive to a firm than issuing new shares. Corporate managers count on inflation to erode the value ofthe firm’s debts even as the selling price of the company’s output increased.In a deflationary environment, however, these dynamics are reversed. Deflation increases the real valueof outstanding debts. At the same time,companiesfind that to repay their loans, they must dip into profitsthat are declining. In 1997 and 1998, companies based in Southeast Asia faced lower selling prices andmounting real values of their indebtedness. In addition, the relative values of their currencies fell,andmany of their debts were denominated in dollars. Thus in addition to a rising real value of their debts inlocal currency, theyalsohad to use more units of it to buy dollars to pay off their dollar indebtedness.In the past few years, U.S. manufacturing companies have been seeing their selling prices declining.Corporate treasurers in these industries are now talking about a new balance sheet paradigm in whichcompanies will rely much more heavily on issuing stock instead of borrowing.In what ways might deflation affect an individual’s well-being? For persons who are creditors, deflation meansan increase in the real value of the debts owed to them as well as increases in the purchasing power of theinterest payments. For example, a retired person with certificates of deposit and shares in a bond mutualfund should experience a net increase in both wealth and his or her standard of living. Debtors will findthat they are worse off because they will have to pay off debts in dollars that are worth more inpurchasing power terms than the ones they borrowed. In a practical sense, the debt repayments will bemade from a lower dollar income for the average debtorbecausea falling price level means lower dollarincomes on the average. So, someone paying off a car loan over a five-year period would find him-orherself giving up increasing amounts of purchasing power.Chapter 11Classical and Keynesian Macro AnalysesAn Antiterrorism Regulation Creates an Aggregate Supply ShockIn August 2002, President George Bush signed the Trade Act, which, among other things, created a newset of transportation security rules aimed at reducing the likelihood that terrorists would smuggle weaponsinto the United States. The new rules apply to every mode of transportationtrucks, trains, ships, andplanesand require these transportation companies to send e-mails or faxes notifying the Bureau ofCustoms and Border Protection of the contents of all cargoes and the intended recipients. The purposeis to give officials time to identify suspicious shipments so that they can intercept and inspect them forcontraband. The advance notice varies with the type of transportation, ranging from 30 minutes for trucksto 24 hours for ships.Large trucking companies had electronic systems to direct deliveries,so they made costly modificationsto them to send automatic messages to government officials. Smaller companies incurred greater costsbecause they had to make rapid transitions to electronic systems or buy fax machines and incur muchhigher long-distance phone charges. The two-hour notification requirement for international cargoesrequired FedExand similar companies to have to restructure aspects of their overnight deliverysystems. Freight trainoperatorsand owners of cargo ships also had to make expensive changes in theirrecord-keeping procedures.The effect was to increase shipping prices for U.S. companies using importedcomponents for their products.These companies also had to make adjustments in their inventorymanagement systems to take into accountregulation-induced shipping delays. Over time, the effects onshipping costs and inventory management costs diminished.
Page 25 of 31
Solution Manual for Economics Today The Macro View, 20th Edition - Page 25 preview image510MillerEconomics Today,Eighteenth EditionWhat was the effect on the short-run aggregate supply curve of the Trade Act? Explain. The short-runsupply curve decreased. In addition to higher shipping costs, the delays caused by the Trade Act wouldhave meant that firms would have had their goods and/or resources tied up in the inspection process. As aconsequence, the delays would have slowed deliveries. Thus,the payments for these goods and servicesor resources that could have been used to produce goods and services would have been idle during thedelays. In either case, firms would have been able to produce less with the same resources as a result ofthe delays associated with the inspection process.How Sticky Are Prices in the United States Economy?Mark Mils and Peter Klenow, in a 2004 paper, “Some Evidence on the Importance of Sticky Prices,”intheJournal of Political Economy,made a study of how often prices change in the U.S. economy. Whatthey found is that in the U.S. economy, the median time between time and price changes (excludingtemporary price changes such as sales and specials) was 8 to 12 months. It is also the case that serviceprices change less often than goods prices, and prices of goods that use a high proportion of raw materialschange more often, as do prices of unprocessed food items.Suppose that there is a supply shock,such as the increase in oil and other energy prices that occurred afterHurricane Katrina. In less than a year, these prices fell from their high point in the fall of 2005, as GulfCoast refineries were brought back online and much of the damage to Gulf oil and gas production wasrepaired. The price of oil did not fall all the way back to summer 2005 levels,but this was due to otherfactors such as cutbacks in production by OPEC and a continuation of rising demand for oil by China andIndia in 2006. Also,there was relatively little change in the U.S. rate of inflation in late 2005 and 2006.If Mils and Klenow’s work is correct, why didn’t the inflation rate increase in 2006 as a result of the Katrinasupply shock? If prices do not change in the economy more often than every 8 to 12 months, then the short-run aggregate supply curve will not shift upward immediately following a supply shock. In fact, it shouldtake at least 8 to 12 months before it shifted upward. During the adjustment time, the price of oil andother energy declined. The price of oil and other energy products did not stay at their highest levels longenough to permanently affect the price level.Drilling for Offshore OilIn 2010, the Obama administration implemented more restrictive regulation of oil exploration and productionin the areas just offshore of the United States. The cost of drilling offshore oil wells is likely to increasesignificantly as a result. Based on current assessments,these areashavean estimated 18 billion barrelsofoil. As a result of the environmental catastrophe associated with the British Petroleum oil spill inthe Gulfof Mexico,considerable controversysurroundsdeveloping these oil resources.Environmentalists arguethat the effect on a fragile ocean ecosystem makes drilling and pumping oil from these locations toocostly. Thus,they strongly oppose drilling there.What will happen to the long-run aggregate supply curve (LRAS) as a result of the implementation ofthese more restrictive regulations on drilling for offshore oil?Assuming that regulation increases costs and reduces drilling activity, the effect would be to shift theLRAScurve to the left. The reason is that the United States would have decreased supply of oil availableto the U.S. economy.Banning Women from the Labor Force: The Case of AfghanistanInthe mid-1990s, the Taliban seized power in Afghanistan after 18 years of war and proclaimed afundamentalist Muslim state. This strict Muslim state existed until the Taliban government wasoverthrown in 2002 by the U.S. military and the Northern Alliance. As part of the Muslim principles as
Page 26 of 31
Solution Manual for Economics Today The Macro View, 20th Edition - Page 26 preview imageLecture Extender Examples511interpreted by the ruling clerics, women’s activities were severely restricted. Women and girls wereforbidden to go to offices and schools. The restriction on gainful employment was particularly painful forwomen who were sole supporters of their families. After 18 years of war,there were many fewer men tosupport families.It was estimated that women made up 10 percent of the labor force before the Taliban seized power sothat the prohibition on women working reduced the labor force by 10 percent.What would have happened to real GDP and the price level after the Taliban took over Afghanistan?Explainusing aggregate demandaggregate supply analysis. Real GDP would have decreased both long-and short-run aggregate supply because the labor force would have decreased. Given the aggregatedemand curve, real GDP would have decreased. The aggregate supply curves would intersect theaggregatedemand curve at a higher price level.Chapter 12Consumption, Real GDP, and the MultiplierThe Financial Crisis of 2008 and the U.S. Saving FunctionIn the fall of 2008, the global financial crisis set off fears of a recession. As the financial markets andstock prices collapsed, households, fearing a recession, began to save more. The Keynesian modelpredicts that the result of households increasing saving to protect themselves from the expected recessioncan actually cause a recession to occur.How would it be possible for increased saving to cause a recession to occur in the Keynesian model?Explainusing the simple fixed price level Keynesian model. If households increase saving, they cause thesavingfunction to shift upward. As a result, the consumption function shifts downward and theC+I+G+net exports function shifts downward. The equilibrium level of real GDP decreases, other held thingsconstant, causing a recession.Changes in Wealth and ConsumptionIn the third quarter of 2008,the financial markets collapsed along with the housing market where housingprices began falling after 2008 and continued into2011. Could this fact explain the slow recovery ofconsumption spending?Yes. The continuing decrease in housing prices has decreased consumer wealth. Thus,even after personalincome began growing again in thethirdquarter of 2009, the decrease in household wealth would haveresulted in a downward shift of the consumption function.Is the U.S. Rate of Investment Understated?Investment is measured in the national income accounts as the sum of spending on physical capitalplants and equipment, infrastructure, and housingand adjustments to inventories of produced goods.Using this definition, the portion of U.S. real GDP allocated to investment lags behind much of the restof the developed world. Some economists worry that the result is that total planned expenditures aredepressed along with equilibrium income. In addition, these economists are concerned that the lower rateof investment reduces the rate of capital accumulation and reduces economic growth.Other economists believe that the current definition of investment fails to capture the true meaning of theterm. Most of measured investment spending is on capital, i.e., resources used to produce output in thefuture. There are at least three other types of expenditures that appear to fit this definition, which are notcurrently included in investment. The first is education, which yields returns over long periods of time.Much of educational spending is for investment in human capital. Currently, only spending on schools
Page 27 of 31
Solution Manual for Economics Today The Macro View, 20th Edition - Page 27 preview image512MillerEconomics Today,Eighteenth Editionand educational equipment are included in investment spending. The United States allocates nearly7percent of real GDP to education. In most other countries,it is 5.5 percent or less. Second is spendingon researchand development (R&D). R&D expenditures are counted as government consumption andprivate productioncosts. It is clear that R&D expenditures aid economic growth. The United Statesallocates about 3 percent of real GDP to R&D, while most other countries allocate 2 percent or less.Finally, consumer durables yield a stream of services over a number of years, yet only housing is countedas investment in the national income accounts. U.S. households spend about 6 percent of real GDP forother durables that yield service flows for years.Another factor in comparing the U.S. investment rate with that of other countries is that U.S. investmentgoods are less expensive. That is, a given dollar of spending on factories or equipment provides moreunits of these goods in the United States as compared to other countries.When all of these factors are taken into account, the adjusted measure of investment of the United Statesexceeds 35 percent per year, while the average rate adjusted the same way for other industrialized countriesis about 30 percent.The MPC and the Multiplier in the United StatesA significant issue from2009to2012was the problem of slow economic growthafter therecessionthatbegan in late 2007. An important problem was predicting what would “get the economy growing”fastenough to get out of a “jobless recovery.” Part of the issue could be viewed as the amount of new spendingthat would be needed. The multiplier concept would be useful in determining the answer to this problem.The multiplier concept appears to suggest that the MPC,and thus the multiplier,isconstant overtime, sothat the size of a given change in autonomous spending will have a predictable effect on equilibriumrealGDP. According to the national income and product tables given by the Bureau of Economic Analysisfor real GDP and personal consumption expenditures (PCE) in billions of2005dollars for the years20092012are:YearReal GDPPCE200912,7589,032201013,0639,196201113,2999,429201213,6169,630As an economic analyst, you could use these figures to determine the simple multiplier to predict givenchanges in autonomous spending.Instruct students to compute the MPC for the years20092010and for20112012. What would be thevalues of the simple multiplier for these two time periods? MPC between2009and2010is the change inconsumption (PCE) of $164divided by the change in real GDP of$305or 0.54. Between2011and2012,the change in consumption (PCE) of $201divided by the change in real GDP of $317or 0.63. Theresulting simple multipliers 1/(1MPC) would be 1/(10.54)=2.16for20092010and 1/(10.63)=2.73for20112012.Why would a stable multiplier be necessary to come up with the appropriate change in autonomousspending? Would these simple multipliers help if they were correct forthe economy as a whole? Ifthe simple multipliers shown were the correct ones for the economy, they would not provide muchguidance for a person trying to determine how much of a change in autonomous spending would beneeded. A stablemultiplier would be needed to be able to predict the effect of a given change inautonomous on the equilibrium level of real GDP.
Page 28 of 31
Solution Manual for Economics Today The Macro View, 20th Edition - Page 28 preview imageLecture Extender Examples513Chapter 13Fiscal PolicyDirect Offset of Government GrantsPrivate companies fund a considerable amount of scientific and engineering research. So does thegovernment. Although some of this research is conducted by people directly employed by governmentagencies, the government also helps fund research by providing grants to researchers. Many such grantsprovide dollar payments directly to researchers to fund all or part of their salaries and those of theirassistants. In addition, the government often helps pay for special equipment for various researchfacilities.Since 2000, the number of full-time researchers using funds provided by government grants has risen by9percent. Total federal outlays for research and development have increased by more than 45 percent. Inthe absence of government grants, a portion of this growth in research funding would have been providedby the private sector. This helps explain why the government’s share of total national spending onresearch and development has risen from 25 percent to about 35 percent today.How might increased government spending on research and development that simply replaces privatespending dollar for dollar affect aggregate demand? It would result in no change in aggregate demandbecause the increase in government spending would be exactly offset by an equal decrease in plannedprivate spending on research and development.The U.S. Government Finds an Unexpected Leak in Its Stream of Tax RevenuesMost federal tax revenues come from income taxes. Therefore, to predict its tax collections accurately, theU.S. government must accurately forecast GDP. The government has never performed this task very well,however, so its tax revenue projections are notoriously inaccurate. Another problem has emerged in the2000s that caused it to overpredict its income tax collections. Under U.S. tax laws, workers pay taxes onincome they receive via paychecks or direct deposits to their bank accounts. They do not, however, oweincome taxes on any portion of their incomes that is withheld to pay for their contributions to employer-provided health plans. Before 2002, workers’ incomes and health benefit contributions typically increasedat the same pace from year to year. After 2003,this pattern changed. Many workers agreed to acceptlower wage and salary increases in exchange for enhanced health benefits. Nontaxable workercontributions to health care plans rose twice as fast as taxable incomes. The result was a smaller increasein total taxable earnings than the government had forecast. Consequently, the government overstated theamount of income tax revenues that it would collect.In the debate concerning the new national health care bill passed, some congressmen proposed makinghealth care benefits taxable. What would be the likely effect of such a plan on aggregate demand? Totalincome taxes paid by workers would increase, so aggregate demand would decrease as the workers’disposable income decreased.The Effects of the Bush Tax CutsIn 2001, the Bush administration was faced with a recession and a budget surplus. Keynesian economicpolicy suggested that the use of an expansionary fiscal policy could counter the recession. The Bushadministration chose to cut taxes because this was also a policy that it had campaigned on in 2000. Thetax cuts did, in fact, provide a stimulus to the economy in the short run. The tax cuts also were designedto shift the largest sums of tax savings to upperincome groups because the Bush administration used thesupply-side economics argument that these tax cuts would stimulate saving and thus investment. Theresult would be economic growth and a long-run increase in income levels. Ultimately, the level ofincome in the economy would rise so much that the resulting increase in tax revenues would eliminateany deficit that might result.
Page 29 of 31
Solution Manual for Economics Today The Macro View, 20th Edition - Page 29 preview image514MillerEconomics Today,Eighteenth EditionThe Congressional Research Service estimated that the economic stimulus that the Bush tax cuts hadcaused had become virtually negligible by 2006. The deficits primarily caused by these cuts were verylarge and had resulted in a significant growth in the deficit and resulting government borrowing. Theinterest payments on this new debt offset about a quarter of the growth of revenue that occurred.In thelong run,it appearsthattax cuts, especially large ones, ultimately add to the deficit.Where on the Laffer curve did the Bush administration think the economy was located? It believed thatthe economy was on the downward-sloping portion past the point at which tax revenues are maximized.Thus,cuts in tax rates would increase government tax receipts.Where was the economy actually located on the Laffer curve? It was on the rising portion of the Laffercurve before tax revenues were at a maximum. Revenues fell with decreases in tax rates, and the deficitincreased.Crowding-Out Effectsduring World War IIMost American history books point to World War II as a clear-cut example of beneficial expansionary fiscalpolicy in action. The U.S. economy was pulled out of the Great Depression by enormous governmentaloutlays for the war effortor so the story goes. The actual situation was that the U.S. economy’s growthrate from 1933 to 1941 was already higher than any other recorded peacetime period of the same length.Moreover, the increase in military expenditures during World War II was not matched by a similar increasein total output. In fact, it looks as if the crowding-out effect was relatively large, at least larger than thehistory books indicate. This can be readily observed in terms of what happened to personal consumptionexpenditures. They dropped by 3.5 percent in real terms from 1941 and 1942 and did not rebound to1941 levels until after 1944. In other words, the average American saw no real increase in livingstandards during the war, in spite of massive military expenditures.Given the information presented here, what could you say about the government’s spending multiplierduring World War II? It appears to have been less than one if total output did not increase as much asmilitary spending. There are two possible explanations. One is that to continue spending at the same paceeven after cutting taxes, the government had to borrow to finance the resulting deficit. Consequently,market interest rates rose, thereby causing a crowding-out effect: an offsetting fall in private spending.Another potential explanation is that people behaved in a way predicted by the Ricardian equivalencetheorem. That is, they realized that the tax reduction today would entail a future tax increase to repay debtthat the government incurred. Thus, people saved the amount of the tax reduction instead of spending it,so that aggregate demand did not change.Islam and Supply-Side EconomicsSupply-side economics has a long history, dating back to at least the fourteenth century. The greatest ofmedievalhistorians, Abu Zayd Abd-ar-Rahman Ibn Khaldun (13321406), included in his book,TheMuqaddimah(1377), an Islamic view of supply-side economics. He pointed out that “when taxassessments . . . upon the subjects are low, the latter have the energy and desire to do things. Culturalenterprises grow and increase . . ..(Therefore) the number of individual imposts (taxes) and assessmentsmounts.” If taxes areincreased in both size and rates, “the result is that the interests of subjects in culturalenterprises disappears,because when they compare expenditures and taxes with their income and gain andsee little profit they make, they lose all hope.” Ibn Khaldun concluded that “at the beginning of a dynasty,taxation yields large revenue from small assessments. At the end of a dynasty, taxation yields smallrevenue from large assessments.”How do this Islamic scholar’s theories apply to the modern world? If a tax hike pushes marginal tax rateshigh enough, then tax revenues may actually fall if incentives to work, save, and invest are reduced.
Page 30 of 31
Solution Manual for Economics Today The Macro View, 20th Edition - Page 30 preview imageLecture Extender Examples515When marginal tax rates are reduced, the incentives to work, save, and invest are increased, and taxrevenues may increase.Keynesian Fiscal Policy and the Financial Crisis of 2008In the last quarter of 2008, a major financial crisis spread from the United States to the global economy.The Federal Reserve created hundreds of billions of dollars and injected them into banks and the financialsystem. It aggressively reduced the federal funds rate to less than 1 percent by early November. Nothingmuch happened because the banks and other parts of the financial system simply held onto most of the moneythat the Fed put into the economy because they perceived the risk of loans not being repaid was too greatto expand them by much. As evidence that monetary policy was ineffective, the actual federal funds ratethat banks charge each other fell as low as 0.22 percent by November, well below the official 1 percenttarget rate. Politicians talked about tax cuts to stimulate the economy as well as increases in spending onsuch things as infrastructure (e.g., roads and bridges). Why the revival of Keynesian fiscal policy?Keynesian fiscal policy was to make short-run adjustments of aggregate demand to get the economy outof a recession or depression when one occurred. If monetary policy is not working because banks hoardreserves, then increased government spending and lower taxes will increase aggregate demand.Chapter 14Deficit Spending and the Public DebtRepublicans and Democrats and the DeficitThe Bush administration began with a $300 billion budget surplus in 2001. The deficit declined to$318billion in 2005. Then fiscal year 2008 ended with a $454 billion deficit.The reason that thebudget surplus disappeared was because of tax cuts by the Bush administration and the RepublicanCongress and war spending.Two different views of the effects of the tax cuts and increased war spending and resulting deficitsemerged from the Republicans and the Democrats. The Republicans argued that the economy was inrecession when the tax cuts were enacted and,along with the war spending, helped stimulate theeconomy. The deficits were declining and would disappear in a few years as the economy continues togrow due to the stimulus that was provided. The Democrats argued that the deficits have had no significantimpact on economic activity because the government borrowing in financial markets offset the increaseddeficit from expansionary fiscal policy. As a result, there was more public spending. The public’s buyingof government bonds has offset private spending. Basically, what has happened is that government’sshare of GDP increased.Which party is using a long-run argument concerning the effects of expansionary fiscal policy and whichis using a short-run one? The Republicans are using a short-run argument. They argue that the warspendingand tax cuts increased aggregate demand during a recession. The Democrats are using a long-runargument,which argues that in the long run, increases in the deficit simply reallocate resources fromproducing private goods to government goods though the crowding-out effect.Would Taxing Internet Sales Wipe Out States’ Deficits?Since 2002, state governments across the United States have faced shortfalls in their state budgetscollectively averaging about $15 billion per year until 2008, when they ballooned during the recessionandafterward. As various state governments searched for new sources of revenue to reduce their budgetdeficits,applying state sales taxes to Internet purchases has emerged as one possibility. At present, a largeportionof the market transactions that take place on the Web are not subject to state sales taxes. How muchrevenuewould taxing Internet sales generate for state governments? Most estimates of the amount thatwould be raised range somewhere between $300 million and $3.8 billion. Thus subjecting all Web
Page 31 of 31
Solution Manual for Economics Today The Macro View, 20th Edition - Page 31 preview image516MillerEconomics Today,Eighteenth Editionpurchases to state sales taxes would raise sufficient revenue to cover a tiny percentage of the states’collective budget deficit.How must governments of states that have constitutions that permit deficit spending always finance theiractual deficits?Becausethe states cannot print money to buy their bonds as the federal governmentcan,they must borrow from the private sector.How must governments of states that have constitutions that do not permit deficit spending alwaysfinance reductions in revenue that would cause a deficit? They must either raise taxes or reduce spending,or some combination of these two options.The Democratic Majority’s AgendaIn 2010, the Republicans regained control of the House of Representatives running on a platform ofeliminatingthe defict or at least drastically reducing it largely by the use of spending cuts.Two problemsfacethe Republicans. Entitlement spending grew to about 58 percent of the federal budget in 2010. Ifinterest on the national debt is added, a littlemore than65 percent of the budget is committed. TheRepublicans in theirPledge to Americapledgednotto cut Social Security, Medicare, or defense spending.If entitlements and defense spending are not to be cut, and interest on the national debt cannot be cut, thenoff-limits spendingaccounts for about nearly 75 percent of the budget, which is accounted for by spendingthat is committedand off limits to reductions for new spending. Entitlements will increase as the BabyBoomers retire and begin drawing Social Security and enrolling in Medicare. The Democrats have alsopledged to increase entitlementse.g., on the Medicare prescription drug plan. The other problem is theenormous cost of dealing with the financial crisis in 2008 and theoccurringrecession . Dealing with theseproblemsis estimated to result in about a $1 trillion increase in government spendingall on top of thecurrent deficit.Why does the automatic growth in entitlement spending complicate efforts to reduce federalgovernment deficits? Reducing deficits requires having revenue grow faster than spending. Growingentitlements meanthat decreases in overall federal spending must come at the expense of new programsor of existingdiscretionary spending. This is a difficult problem for politicians.How does a recession complicate efforts to reduce federal government deficits? Recessions decreaseemployment and income and thus tax-reduced receipts from personal income tax, payroll, and corporateprofits taxes. At the same time, federal spending on unemployment compensation and welfare programssuch as food stamps increases. Thus in a recession, deficits automatically increase as revenues decreaseand spending increases. Any new programs would be unlikely to be financed by a tax increase when theeconomy is in a recession, so the only way to finance new spending programs would be to drasticallyreduce spending on the 25 percent of the government programs that are not committedtoin thePledge toAmerica.Deficits and the Real Tax RateHistorically, Republicans were considered fiscal conservatives and Democrats the opposite. Republicanshave historically been associated with balanced budgets or low deficits. In modern times, that is no longertrue. Democrats argue much more against deficits than do Republicans. Indeed, under Republicanadministrations, deficits have been larger than under Democratic administrations.Some Republicans have been using the argument that real economic growth was higher during years inwhich the net public debt exceeded one-third of GDP than in years when it was less than that. In otherwords, real economic growth was 1 percent higher (almost 3.5 percent) in high-deficit and debt years thanit was in low-deficit years (almost 2.5 percent).
Preview Mode

This document has 556 pages. Sign in to access the full document!