

Solution Manual For Operations and Supply Chain Management, 16th Edition
- Operations Management
- 361 pages
- Shared May 2025
Solution Manual For Operations and Supply Chain Management, 16th Edition makes studying stress-free with well-organized chapter insights.
Preview 16 of 361 pages
See the first 16 pages exactly as they appear in the document.
Page 1 Read page 1 as text
Chapter 01 - Operations and Supply Chain Management 1 - 1 CHAPTER 1 OPERATIONS AND SUPPLY CHAIN MANAGEMENT Discussion Questions 1. Using Exhibit 1.3 as a model, describe the source - make - deliver - return relationships in the following systems: a. An airline Source: Aircraft manufacturer, i n - flight food, repair parts, computer systems Make: Aircraft and flight crew scheduling, ground service s provided at airports , aircraft maintenance and repair Deliver: Outbound and arriving passenger service, baggage handling Return: Resolve any post - service issues such as lost or damaged luggage b. An automobile manufacturer Source: Suppliers of components and raw materials Make: Manufacturing of vehicles and components or subassemblies to be sold as spare parts Deliver: Delivery to and sales from dealerships, delivery o f spare parts to the wholesale system Return: Warranty and recall repairs, trade - ins c. A hospital Source: Medical supplies, cleaning services, disposal services , food services , qualified personnel Make: Inpatient rooms, outpatient clinics, e mergency r oom, o perating r ooms Deliver: Scheduling patients, providing treatment, a mbulance service , family counseling Return: Billing errors, follow up visits d. An insurance company Source: Supplies needed for the office, u nderwriters , legal authority to operate Make: Establish policy guidelines and pricing, field agent/representative and facility network, develop Internet service capabilities, establish preferred vehicle repair service network Deliver: Meet with and advise clients, write policies, process and pay claims Return: refund of overpayments 2. Define the service package of your college or university. What is its strongest element? What is i ts weakest one? The categories with examples are: Supporting facility - location, buildings, labs, parking Facilitating goods – class schedules, computers, books , chalk Explicit services – classes with qualified instructors, placement offices Implicit services – status and reputation (e.g., Ivy League schools)
Page 2 Page 3 Read page 3 as text
Chapter 01 - Operations and Supply Chain Management 1 - 2 At Indiana University and the University of Southern California, among their strongest elements are their business schools and their Operations Management programs (of course). Both also have very dedicated alumni networks. A weak element of Indiana University is its weak football program; for USC, weak elements are on - campus parking and housing. 3. What service industry has impressed you the most with its innovativeness? Our vote goes to cruise lines which have introduced such onboard innovations as wave machines for belly boarding and rock climbing walls, as well as all sorts of other amenities to keep cruisers involved. The industry is doing record business as well. Some of the standout companies in less innovative industries are Bank of America (has a formalized research program to try out new customer services/amenities such as video screens in next to teller lines), Intuit (e.g., putting Quicken money management software online), Ikea, JetBlue Airlines, and Progressive Insurance (discussed later in the book). 4. What is product - service bundling and w hat are the benefits to customers? Product - service bundling is adding Value - added services to a firm’s product offerings to create more value for the customer . Th is provide s bene fits in two areas. First, this differentiate s the organization from the competition. Secondly, these services tie customers to the organization in a positive way. Alternatively, bundling can also involve adding products to a service, for example, adding the sale of convenience items and snacks at a hotel. 5. What is the difference between a service and a good? A service is an intangible process (you can’t hold it in your hands) , while a good is the physical output of a process. 6. Look at the job postings at http:// www.indeed.com and evaluate the opportunities for an OSM major with several years of experience. There are pages and pages of these when you do a search on operations supply chain management . Here are some examples: Global Active Ingredient Supply Planner FMC Corporation US - PA - Philadelphia This is your opportunity to join the Agricultural Products Group (APG) and work on the team responsible for global active ingredient planning. You'll serve as a central Supply Planner working in tandem ... Purchasing Manager (Buyer) Texas Dow Employees Credit Union (TDECU) US - TX - Lake Jackson - Nearest Metro area - South Houston
Page 4 Read page 4 as text
Chapter 01 - Operations and Supply Chain Management 1 - 3 Education Accredited university degree in Business or Marketing with certification in Purchasing, Inventory Management, or Logistics. Accredited Purchasing Practitioner (APP) or Certified Purchasing ... Product Line Manager Cintas Corporation US - OH - Mason High School diploma or GED required, 4 year degree preferred Knowledge of and experience using Internet and Microsoft Office (Word, Excel, PowerPoint, and Email) 3 years management experience preferred ... Director Purchasing Legendary Baking US - CO - Denver CERTIFICATIONS & LICENSES • Valid Driver’s License and car insurance. • Certified Purchasing Manager certification (C.P.M.) preferred. • Certified Food Purchasing Manager ... Process Improvement Manager ARAMARK Corporation US - TX - Houston Bachelor's Degree required. Technical Engineering discipline within Industrial, Mechanical, Chemical, or Food Operations strongly preferred. • Minimum 5 years Lean manufacturing experience coupled ... 7. Recent outsourcing of parts and services that had previously been produced internally is addressed by which current issue facing operations and supply management today? The coordination of relationships between mutually supportive but separate organizations. 8. What factors account for the resurgence of interest in OSCM today? With companies facing competition on a global scale, and ever - advancing manufacturing and information technologies, firms realize the competitive advantage their OSCM functions can provide if properly managed. Many have found that the same old way of doing business leaves them unable to compete successfully. 9. As the field of OSCM has advanced, new concepts have been applied to help companies compete in a number of ways , including the advertisement of the firm’s products or services. One recent concept to gain the attention of companies is promoting s ustainability . Discuss how you have seen the idea of sustainability used by companies to advertise their goods or services. There of course will be a number of examples that students will bring up, though they may need some prodding to jog their memories. Some examples to start with might be IBM’s “I’m an IBMer” campaign where they advertise how they are “building a smarter planet.” Bottled
Page 5 Read page 5 as text
Chapter 01 - Operations and Supply Chain Management 1 - 4 water manufacturers have reduced the amount of plastic used in many of their products, thus saving production and distribution costs, but also allowing them to advertise how the new bottles are better for the environment because they result in less waste. 10. Some people tend to use the terms effectiveness and efficiency interchangeably, though we’ve seen they are different concepts. But is there any relationship at all between them? Can a firm be effective but inefficient? Very efficient but essentially ineffective? Both? Neither? Firms can be anywhere on these two dimensions. It is possible for a firm to be the best at what they do in serving their market, but be very wasteful in doing so. Alternatively, a firm could squeeze every last dollar out of their processes but fail to deliver what the market expects and desires. Of course, the best firms will provide the goods and services that the market desires, exactly as the market desires, and do so at a minimum cost. Firms that are both inefficient and ineffective do not survive for long in any market.
Page 6 Read page 6 as text
Chapter 01 - Operations and Supply Chain Management 1 - 5 Objective Questions 1. What are the three elements that require integration to be successful in operations and supply chain management? (Appendix E) Strategy, Processes, and Analytics 2. Operations and supply chain management is concerned with the design and management of the entire system that has what function? Produces a product or delivers a service 3. Match the following OSCM job titles with the appropriate duties and responsibilities. C Plant manager A: Plans and coordinates staff activities such as new product development and new facility location D Supply chain m anager B: Oversees the movement of goods throughout the supply chain A Project manager C: Oversees the workforce and resources required to produce the firm’s products E Business process improvement analyst D: Negotiates contracts with vendors and coordinates the flow of material inputs to the production process B Logistics manager E: Applies the tools of lean production to reduce cycle time and eliminate waste in a process 4. What high - level position manager is responsible for working with the CEO and company president to determine the company’s competitive strategy? Chief Operating Officer 5. Order the following major concepts that have helped define the OSCM field on a time line. Use 1 for the earliest to be introduced, and 5 for the most recent. 3 Supply c hain m anagement 1 Manufacturing strategy developed 5 Business a nalytics 2 Total q uality m anagement 4 Electronic commerce
Page 7 Read page 7 as text
Chapter 01 - Operations and Supply Chain Management 1 - 6 6. Which major OSCM concept can be described as an integrated set of activities designed to achieve high - volume production using minimal inventories of parts that arrive at workstations exactly when they are needed? Just - in - time (JIT) production 7. Operations and supply chain ___________________________ leverage s the vast amount of data in enterprise resource planning systems to make decisions related to managing resources. analytics 8. A process is ________________ if it operates at the lowest possible cost. Efficient 9. A customer picks a product over a similar product due to the ________________ value of the product. Value
Page 8 Read page 8 as text
Chapter 01 - Operations and Supply Chain Management 1 - 7 Analytics Exercise: Comparing Companies Using Wall Street Efficiency Measures Each student is asked to pick an industry and compare three companies within that industry based on Efficiency Ratios The following is typical of what you might obtain: BP Shell ExxonMobil Management Efficiency Days sales outstanding 29.47 42.70 34.40 Days inventory 28.85 26.51 31.51 Payables period 61.31 53.23 68.69 Cash conversion cycle - 2.99 15.98 - 2.87 Receivables turnover 12.39 8.55 10.64 Inventory turnover 12.65 13.77 11.58 Asset turnover 1.04 0.93 0.78 Students are then asked to identify which company appears to have the most productive employees. With this data we see that ExxonMobil does very well in that its cash conversion cycle is - 2.87 days . Th is is amazing! The Inventory Turnover is highest for Shell indicating that the company is the most efficient from an operations and supply chain processes view. BP has the highest Asset Turnover , which relates to the use of its facility and equipment assets. Overall, these are all three very strong companies relative to there operations and supply chain processes. Of course, the data generated by each student will be different and an interesting interchange can be developed with students each presenting what they found from their research. It is very interesting to do comparisons across industries; retailers versus oil companies, and computer makes versus software companies, for example.
Page 9 Read page 9 as text
Chapter 02 - Strategy and Sustainability 2 - 1 CHAPTER 2 STRATEGY AND SUSTAINABILITY Discussion Questions 1. What are the major priorities associated with operations and supply chain strategy? How has their relationship to each other changed over the years? The four major imperatives are cost, quality, delivery, and flexibility. In the sixties, these four imperatives were viewed from a tradeoff’s perspective. For example, this meant that improving quality would result in higher cost, and in many cases that was true. However, advances in manufacturing and information technologies since then have reduced the size of those tradeoffs, allowing firms to improve on several or all these imperatives simultaneously, gaining greater competitive advantage than was possible 50 years ago. The problem now becomes one of prioritizing and managing towards orderly improvement. 2. Why does the proper operations and supply chain strategy keep changing for companies that are world - class competitors? The top three priorities have generally remained the same over time: make it good, make it fast, and deliver it on time. Others have changed. Part of this may be explained by realizing that world class organizations have achieved excellence in these three areas and are, therefore, focusing attention on some of the more minor areas to gain competitive advantage. The changes in the minor priorities may result from recognizing opportunities or from changes in customer desires or expectations. 3. What do the expressions order winners and order qualifiers mean ? What was the order winner(s) for your last purchase of a product or service? Order winners are dimensions that differentiate the product or service or services of one firm from another. Order qualifiers are dimensions that are used to screen a product or service as a candidate for purchase. Order qualifiers get a company’s “foot in the door.” Order winners are what make the sale. Obviously, answers will vary for the order winners from your last purchase. 4. Pick a company that you are familiar with and describe its operations strategy and how it relates to winning customers. Describe specific activities used by the company that support the strategy. Student answers will vary widely based on their experiences and views. It might be helpful for a classroom exercise to assign certain companies to several students/teams and compare their answers in class. 5. At times in the past, the dollar showed relative weakness with respect to foreign currencies, such as the yen, mark, and pound. This stimulated exports. Why would long - term reliance on a lower valued dollar be at best a short - term solution to the competitiveness problem?
Page 10 Read page 10 as text
Chapter 02 - Strategy and Sustainability 2 - 2 This approach is dependent on economic policies of other nations. This is a fragile dependency. A long - term approach is to increase manufacturing and service industry productivity in order to regain competitive advantage. At a national level, solutions appear to lie in reversing attitudes. At a firm level, competitive weapons are consistent quality, high performance, dependable delivery, competitive pricing, and design flexibility. 6. Identify an operati ons and supply chain - related disruption that recently impacted a company. What could the company have done to have minimized the impact of this type of disruption prior to it occurring? The March 2011 tsunami that struck Japan was geographically concentrated but had global impact on multiple firms, many of which had no physical presence at all in the affected area. Examples include firms that had sole source agreements with suppliers in the affected area. The tsunami left these companies scrambling to find new suppliers to feed into their supply chains. These firms could have reduced the impact of the tsunami by having a few high - quality, dependable suppliers located in different geographical regions. There are many other examples that could be taken from this one event. A simple Internet search will provide plenty of material for discussion. 7. What do we mean when we say productivity is a relative measure? For productivity to be meaningful, it must be compared with something else. The comparisons can be either intra - company as in the case of year - to - year comparisons of the same measure, or intercompany as in the case of benchmarking. Intercompany comparisons of single factor productivity measures can be somewhat tenuous due to differences in accounting practices (especially when comparing with foreign competitors) and the balance of labor to capital resources. Total factor productivity measures are somewhat more robust for comparison purposes. 8. What is meant by triple - bottom - line strategy? Give an example of a company that has adopted this type of strategy. A triple - bottom - line strategy places emphasis on a company’s environmental and social responsibilities as well as the traditional bottom line of economic prosperity. It recognizes that the long - term health of the firm is interdependent with the health of the environment and the betterment of society. There are many examples – an interesting one is Ben & Jerry’s, famous for their all - natural ice cream. Do a search “Ben & Jerry’s Corporate Social Responsibility” to find their current statements related to this. 9. Find examples where companies have used features related to e nvironmental sustainability to win new customers. Car companies use environmental concerns in marketing ads. The development of hybrid and flex - fuel cars is one way they have operationalized those concerns. Consumer goods companies display the “made with recycled material” logo on the packaging. Bottled water manufacturers are using, and advertising bottles made with less plastic.
Page 11 Read page 11 as text
Chapter 02 - Strategy and Sustainability 2 - 3 Objective Questions 1. How often should a company develop and refine the operations and supply chain strategy. At least yearly 2. What is the term used to describe product attributes that attract certain customers and can be used to form the competitive position of a firm? Competitive dimensions 3. What are the two main competitive dimensions related to product delivery? Delivery speed and delivery reliability 4. What are the two characteristics of a product or service that define quality? Design quality and process quality 5. What is the diagram that shows how a company’s strategy is delivered by a set of supporting activities ? activity - system map 6. In implementing supply chain strategy , a firm must minimize its total cost wit hout compromising the needs of what group of people? Customers 7. What is defined as the likelihood of disruption that would impact the ability of a company to continuously supply products or services? Supply chain risk 8. What are r isks caused by natural or manmade disasters, and therefore impossible to reliably predict, called ? Disruption risks 9. Match the following common risks with the appropriate mitigation strategy.
Page 12 Read page 12 as text
Chapter 02 - Strategy and Sustainability 2 - 4 E Country risks A: Detailed tracking, alternate suppliers D Regulatory risk B: Careful select ion and monitor ing suppliers A Logistics failure C: Contingency planning, insurance C Natural disaster D: Good legal advice, compliance B Major quality failure E: Currency hedging, local sourcing 10. What is the term used to describe the assessment of the probability of a negative event against the aggregate severity of the related loss ? Risk mapping 11. As Operations Manager, you are concerned about being able to meet sales requirements in the coming months. You have just been given the following production report. JAN FEB MAR APR Units Produced 2300 1800 2800 3000 Hours per Machine 325 200 400 320 Number of Machines 3 5 4 4 Find the average monthly productivity (units per machine hour). To answer this we need to realize that the measure of hours given is per machine, so we have to multiply that by the number of machines in each period to get the total machine hours in each period. Those figures are used in the calculations below. Average productivity: (2300/ 975 + 1800/ 1000 + 2800/ 1600 + 3000/1280)/4 Average productivity (2.36+1.80+1.75+2.34)/4= 2.06 units per machine hour 12. Sailmaster makes high - performance sails for competitive windsurfers. Below is information about the inputs and outputs for one model, the Windy 2000. Units sold 1,217
Page 13 Read page 13 as text
Chapter 02 - Strategy and Sustainability 2 - 5 Sale price each $1,700 Total labor hours 46,672 Wage rate $12/hour Total materials $60,000 Total energy $4,000 Calculate the productivity in sales revenue/labor expense . We have to do some interim calculations here. Sales revenue is calculated by multiplying units sold by the unit sales price. Labor expense is calculated by multiplying labor hours by the wage rate. (1217*1700) / (46672*12) = 3.69 13. Live Trap Corporation received the data below for its rodent cage production unit. Find the total productivity? Output Input 50,000 cages Production time 620 labor hours Sales price: $3.50 per unit Wages $7.50 per hour Raw materials (total cost) $30,000 Component parts (total cost) $15,350 Total productivity could be expressed two ways here based on how you express output: in units sold, or dollars of sales. Units sold: 50,000 / ((620 * $7.50) + 30,000 + 15,350) = 1.00 units sold per dollar input Dollars of sales: (50000*3.5) / ((620 * $ 7.5 0 ) + 30 , 000 + 15 , 350) = 3.5 dollars in sales per dollar input 14. Two types of cars (Deluxe and Limited) were produced by a car manufacturer last year. Quantities sold, price per unit, and labor hours follow. What is the labor productivity for each car? Explain the problem(s) associated with the labor productivity. QUANTITY $/UNIT Deluxe car 4,000 units sold $8,000/car Limited car 6,000 units sold $9,500/car Labor, Deluxe 20,000 hours $12/hour Labor, Limited 30,000 hours $14/hour Labor Productivity – units/hour
Page 14 Read page 14 as text
Chapter 02 - Strategy and Sustainability 2 - 6 Model Output in Units Input in Labor Hours Productivity (Output/Input) Deluxe Car 4,000 20,000 0.20 units/hour Limited Car 6,000 30,000 0.20 units/hour Labor Productivity – dollars Model Output in Dollars Input in Dollars Productivity (Output/Input) Deluxe Car 4,000($8,000)= $32,000,000 20,000($12.00)= $240,000 133.33 Limited Car 6,000($9,500)= $57,000,000 30,000($14.00)= $420,000 135.71 The labor productivity measure is a conventional measure of productivity. However, as a partial measure, it may not provide all of the necessary information that is needed. For example, increases in productivity could result from decreases in quality, and/or increases in material cost. 15. A U.S. manufacturing company operating a subsidiary in an LDC (less - developed country) shows the following results: U.S. LDC Sales (units) 100,000 20,000 Labor (hours) 20,000 15,000 Raw materials (currency) $20,000 FC 20,000 Capital equipment (hours) 60,000 5,000 a. Calculate partial labor and capital productivity fi gures for the parent and subsidiary. Do the results seem misleading? Labor Productivity Country Output in Units Input in Hours Productivity (Output/Input) U.S. 100,000 20,000 5.00 units/hour LDC 20,000 15,000 1.33 units/hour Capital Equipment Productivity Country Output in Units Input in Hours Productivity (Output/Input) U.S. 100,000 60,000 1.67 units/hour LDC 20,000 5,000 4.00 units/hour
Page 15 Read page 15 as text
Chapter 02 - Strategy and Sustainability 2 - 7 Yes. You might expect the capital equipment productivity measure to be higher in the U.S. than in a LDC. Also, the measures seem contradictory. Each plant appears to be far more productive than the other on one measure, but much worse on the other. b. Compute the multifactor productivity fi gures for labor and capital together. Do the results make more sense? Multifactor – Labor and Capital Equipment Country Output in Units Input in Hours Productivity (Output/Input) U.S. 100,000 20,000 + 60,000= 80,000 1.25 units/hour LDC 20,000 15,000 + 5,000= 20,000 1.00 units/hour Yes, labor and equipment can be substituted for each other. Therefore, this multifactor measure is a better indicator of productivity in this instance. c. Calculate raw material productivity fi gures (units/$ where $1 = FC 10). Explain why these fi gures might be greater in the subsidiary. Raw Material Productivity Country Output in Units Input in Dollars Productivity (Output/Input) U.S. 100,000 $20,000 5.00 units/$ LDC 20,000 FC 20,000/$10 = $2,000 10.00 units/$ The raw material productivity measures might be greater in the LDC due to a reduced cost paid for raw materials, which is typical of LDC’s , especially if there are local sources for the raw materials. 16. Various fi nancial data for the past two years follow. Calculate the total productivity measure and the partial measures for labor, capital, and raw materials for this company for both years. What do these measures tell you about this company? Last Year This Year Output: Sales $200,000 $220,000 Input: Labor 30,000 40,000 Raw materials 35,000 45,000 Energy 5,000 6,000
Page 16 Read page 16 as text
Chapter 02 - Strategy and Sustainability 2 - 8 Capital 50,000 50,000 Other 2,000 3,000 Total Productivity Year Output in Dollars Input in Dollars Productivity (Output/Input) Last Year $200,000 $30,000 + 35,000 + 5,000 + 50,000 + 2,000 = $122,000 1.64 This Year $220,000 $40,000 + 45,000 + 6,000 + 50,000 +3,000 = $144,000 1.53 Partial Measure – Labor Year Output in Dollars Input in Dollars Productivity (Output/Input) Last Year $200,000 $30,000 6.67 This Year $220,000 $40,000 5.50 Partial Measure – Raw Materials Year Output in Dollars Input in Dollars Productivity (Output/Input) Last Year $200,000 $35,000 5.71 This Year $220,000 $45,000 4.89 Partial Measure – Capital Year Output in Dollars Input in Dollars Productivity (Output/Input) Last Year $200,000 $50,000 4.00 This Year $220,000 $50,000 4.40 The overall productivity measure is declining, which indicates a possible problem. The partial measures can be used to indicate cause of the declining productivity. In this case, it is a combination of declines in both labor and raw material productivity, which were somewhat offset by an increase in the capital productivity. Further investigation should be undertaken to explain the drops in both labor and raw material productivity. An increase in the cost of
345 more pages in the full document
Unlock it once and it stays in your library, ready to chat with or turn into flashcards.
Unlock the full documentMore Operations Management study materials
See all Textbook Guides
Solution Manual for Operations and Supply Chain Management, 14th Edition
Operations Management
342 pages133downloadsFeb 2025 Exam Guides
Test Bank For Operations And Supply Chain Management, 14th Edition
Operations Management
1011 pagesMay 2025 Textbook Guides
Solution Manual for Operations and Supply Chain Management: The Core, 5th Edition
Operations Management
299 pagesMay 2025 Textbook Guides
Managing Quality: Integrating the Supply Chain, 6th Edition Solution Manual
Operations Management
262 pages115downloadsFeb 2025 Textbook Guides
Operations Management, (Mcgraw-hill Education Operations and Decision Sciences) 1st Edition Solution Manual
Operations Management
153 pages91downloadsFeb 2025 Textbook Guides
Solution Manual For Matching Supply with Demand: An Introduction to Operations Management, 4th Edition
Operations Management
76 pages36downloadsFeb 2025 Exam Guides
Operations Management, 5th Canadian Edition Test Bank
Operations Management
1208 pagesMay 2025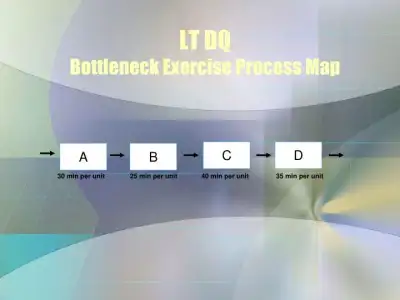 Class Notes
LT DQ Bottleneck Exercise Process Map
Operations Management
1 pageMay 2025
Study this document with CramX
Once it is in your library, every tool can work from it.