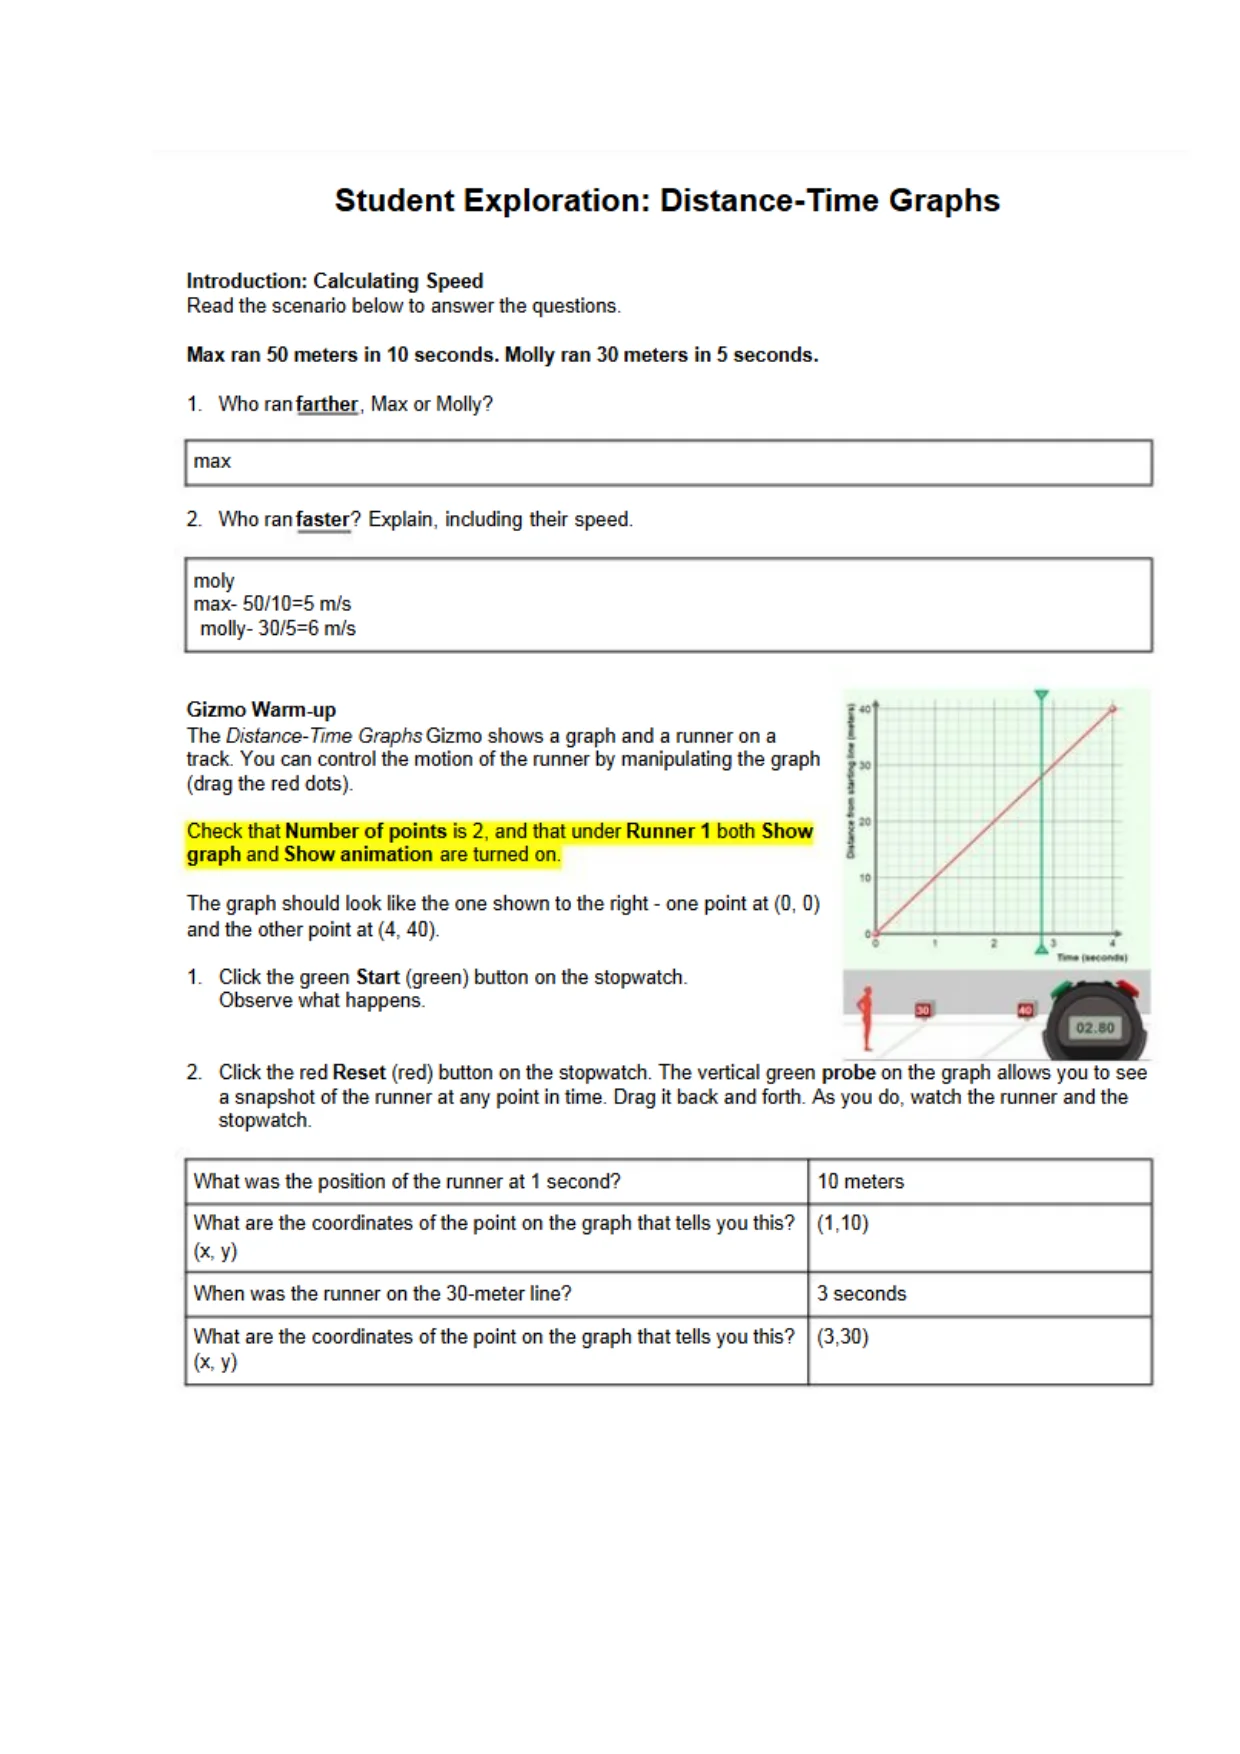
 Student Exploration: Distance-Time GraphsIntroduction: Calculating SpeedRead the scenario below to answer the questions.Max ran 50 meters in 1 0 seconds. Molly ran 30 meters i n 5 seconds.1.Who ran farther , Max or Molly?max2.V/ho ran faster? Explain, including their speed.molymax- 50/10=5 m/smolly- 30/5=6 m/sGizmo Warm-upTheDistance-Time GraphsGizmo shows a graph and a runner on atrack. You can control the motion of the runner by manipulating the graph(drag the red dots).Check that Number o f points is 2, and that under Runner 1 both Showgraph and Show animation are turned on.The graph should look like the one shown to the right - one point at (0, 0)and the other point at (4, 40).1.Click the green Start (green) button on the stopwatch.Observe what happens.Click the red Reset (red) button on the stopwatch. The vertical green probe on the graph allows you to seea snapshot of the runner at any point in time. Drag it back and forth. As you do;watch the runner and thestopwatch.2.What was the position of the runner at 1 second?10 metersWhat are the coordinates of the point on the graph that tells you this?(x:y)( H O )When was the runner on the 30-meter line?3 secondsWhat are the coordinates of the point on the graph that tells you this?(x:y)(3,30)
Preview Mode
This document has 12 pages. Sign in to access the full document!