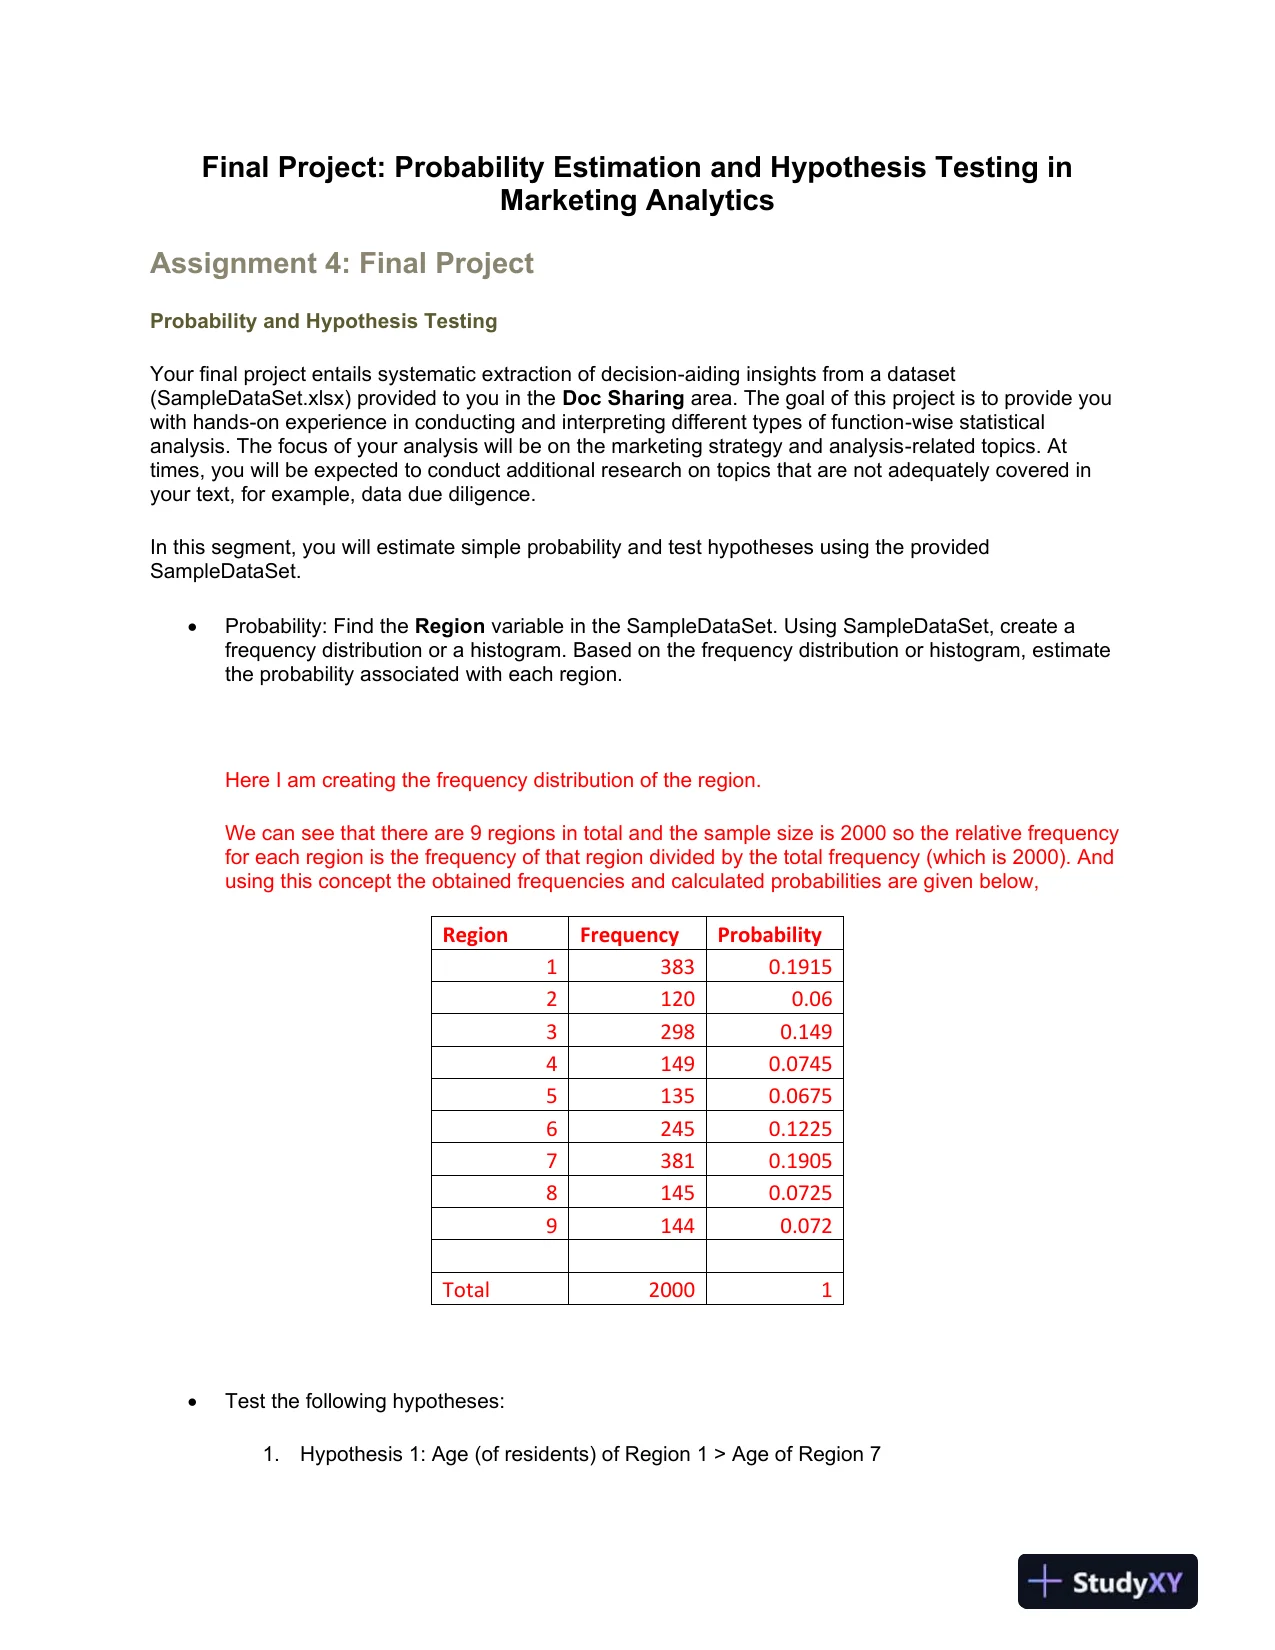
 Final Project: Probability Estimation and Hypothesis Testing inMarketing AnalyticsAssignment 4: Final ProjectProbability and Hypothesis TestingYour final project entails systematic extraction of decision-aiding insights from a dataset(SampleDataSet.xlsx) provided to you in theDoc Sharingarea. The goal of this project is to provide youwith hands-on experience in conducting and interpreting different types of function-wise statisticalanalysis. The focus of your analysis will be on the marketing strategy and analysis-related topics. Attimes, you will be expected to conduct additional research on topics that are not adequately covered inyour text, for example, data due diligence.In this segment, you will estimate simple probability and test hypotheses using the providedSampleDataSet.•Probability: Find theRegionvariable in the SampleDataSet. Using SampleDataSet, create afrequency distribution or a histogram. Based on the frequency distribution or histogram, estimatetheprobability associated with each region.Here I am creating the frequency distribution of the region.We can see that there are 9 regions in total and the sample size is 2000 so the relative frequencyfor each region is the frequency of that region divided by the total frequency (which is 2000). Andusing this concept the obtained frequencies and calculated probabilities are given below,RegionFrequencyProbability13830.191521200.0632980.14941490.074551350.067562450.122573810.190581450.072591440.072Total20001•Test the following hypotheses:1.Hypothesis 1: Age (of residents) of Region 1 > Age of Region 7
Preview Mode
This document has 3 pages. Sign in to access the full document!