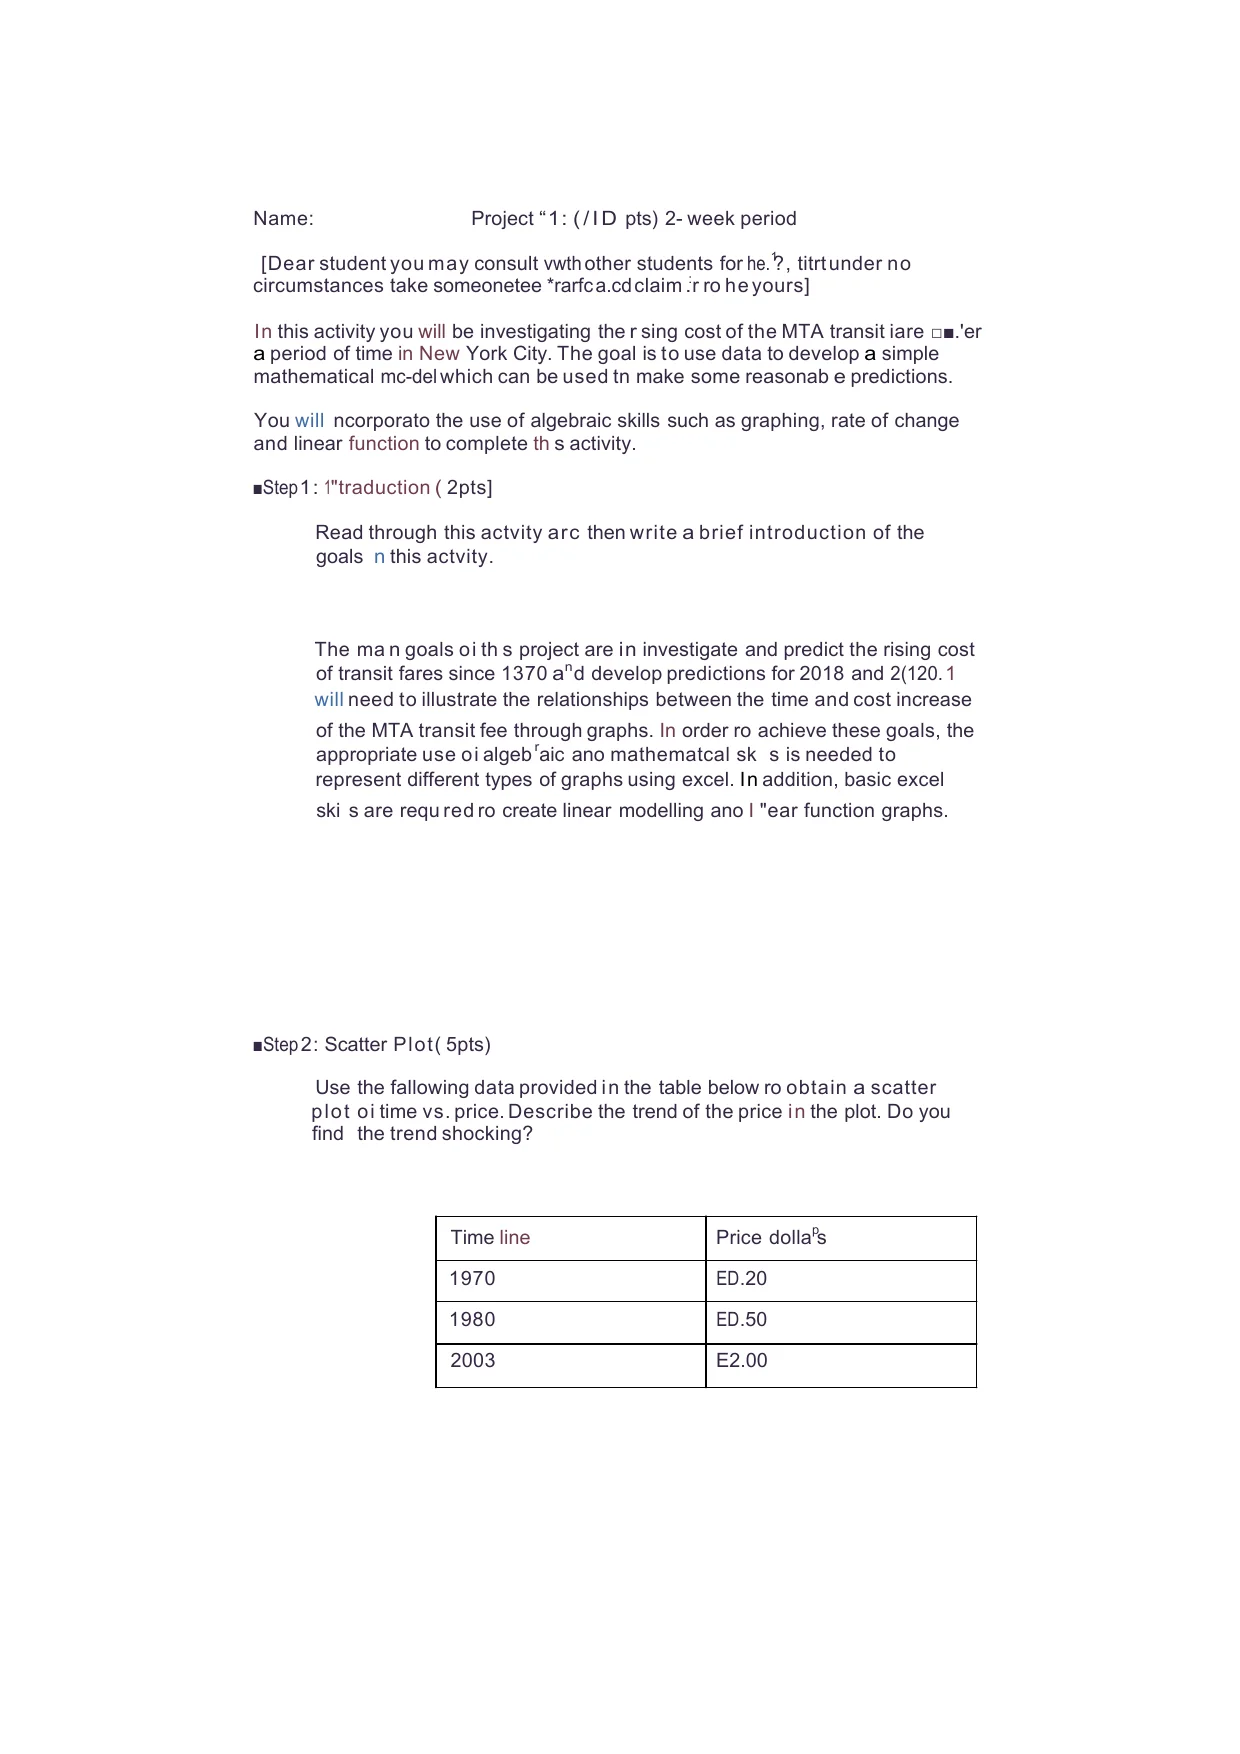
 Name:Project “1: ( / I D pts) 2- week period[Dear student you may consult vwth other students for he.1?, titrt under nocircumstances take someonetee *rarfc a.cd claim .:r ro he yours]In this activity you will be investigating the r sing cost of the MTA transit iare□■.'era period of time in New York City. The goal is to use data to develop a simplemathematical mc-del which can be used tn make some reasonab e predictions.You will ncorporato the use of algebraic skills such as graphing, rate of changeand linear function to complete th s activity.■Step1: 1"traduction ( 2pts]Read through this actvity arc then write a brief introduction of thegoals n this actvity.The ma n goals oi th s project are in investigate and predict the rising costof transit fares since 1370 and develop predictions for 2018 and 2(120. 1will need to illustrate the relationships between the time and cost increaseof the MTA transit fee through graphs. In order ro achieve these goals, theappropriate use oi algebraic ano mathematcal sks is needed torepresent different types of graphs using excel. In addition, basic excelski s are requ red ro create linear modelling ano I "ear function graphs.■Step 2: Scatter Plot( 5pts)Use the fallowing data provided i n the table below ro obtain a scatterplot oi time vs. price. Describe the trend of the price i n the plot. Do youfindthe trend shocking?Time linePrice dollaps1970ED.201980ED.502003E2.00
Preview Mode
This document has 7 pages. Sign in to access the full document!