MATH 1530 Capstone Technology Project Summer 2015

A capstone project applying mathematical models to real-world problems.

Isabella White
Contributor
4.8
52
10 months ago
Preview (6 of 17 Pages)
100%
Log in to unlock

Page 1

MATH 1530 Capstone Technology Project Summer 2015 - Page 1 preview image

Loading page ...

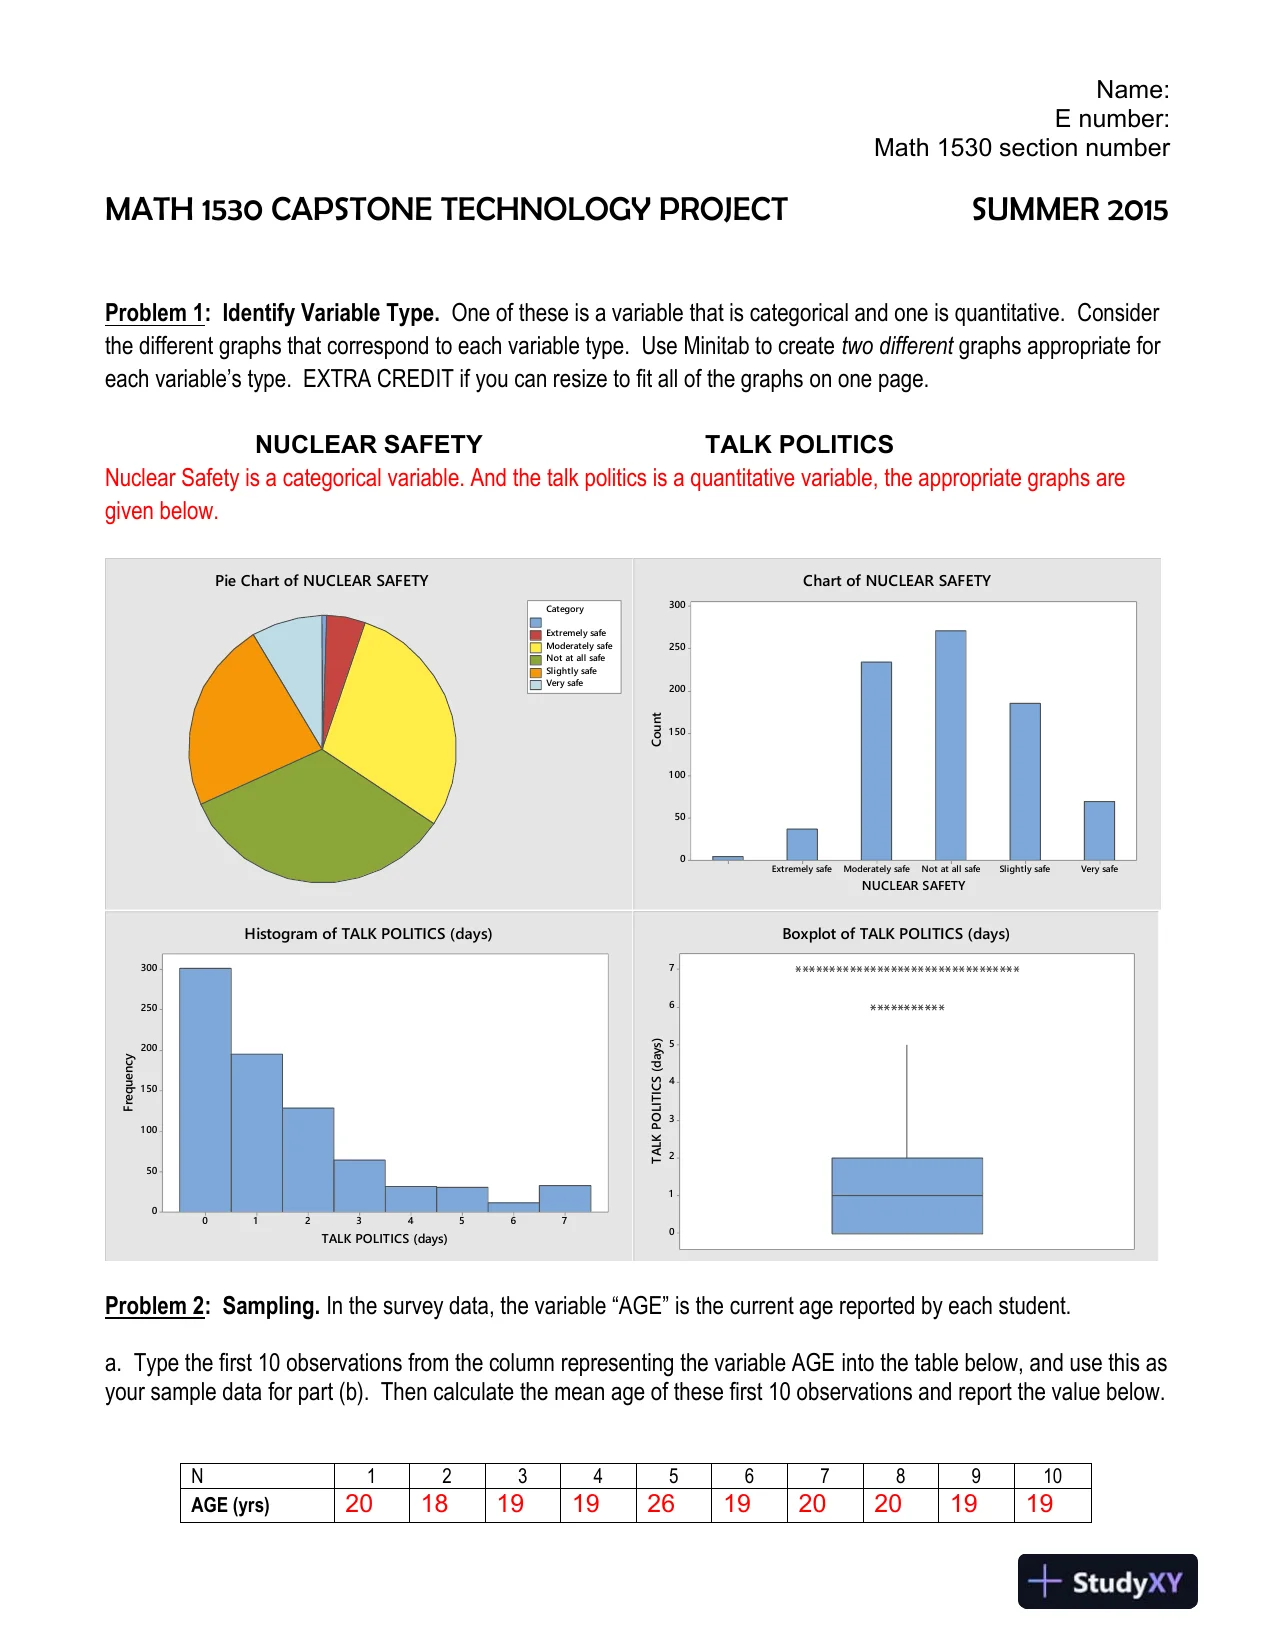
Name:E number:Math 1530 section numberMATH 1530 CAPSTONE TECHNOLOGY PROJECTSUMMER 2015Problem 1:Identify Variable Type.One of these is a variable that is categorical and one is quantitative.Considerthe different graphs that correspond to each variable type. Use Minitab to createtwo differentgraphs appropriate foreach variable’s type. EXTRA CREDIT if you can resizeto fitall of the graphson one page.NUCLEAR SAFETYTALK POLITICSNuclear Safety is a categorical variable. And the talk politics is a quantitative variable, the appropriate graphs aregiven below.Problem 2:Sampling.In the survey data, the variable “AGE”is the current age reported by each student.a.Type the first 10 observations from the column representing the variable AGEinto the table below,and use this asyour sample datafor part (b). Then calculate the mean age of these first 10 observations and report the value below.N12345678910AGE (yrs)20181919261920201919ExtremelysafeModeratelysafeNotatallsafeSlightlysafeVerysafeCategoryPieChartofNUCLEARSAFETYVerysafeSlightlysafeNotatallsafeModeratelysafeExtremelysafe300250200150100500NUCLEARSAFETYCountChartofNUCLEARSAFETY76543210300250200150100500TALKPOLITICS(days)FrequencyHistogramofTALKPOLITICS(days)76543210TALKPOLITICS(days)BoxplotofTALKPOLITICS(days)

Page 2

MATH 1530 Capstone Technology Project Summer 2015 - Page 2 preview image

Loading page ...

Page 3

MATH 1530 Capstone Technology Project Summer 2015 - Page 3 preview image

Loading page ...

Name:E number:Math 1530 section numberb.The mean age of the first 10 students is19.9years.(Type the value into the space provided.)c.Identify the type of sampling method you havejust used:This is an example of convenience sampling.d.Next, select a random sample of size n = 10 (Go to Calc > Random Data > Sample from Columns). Type thenumber 10 in the “Number of rows to Sample” slot. Enter the variable “ID” and “AGE” into the “From columns” slot.Enter C17-C18 into the “Store samples in” slot. Record the data for your sample in the table below.N12345678910ID6624820663649209422414279565AGE (yrs)24181835194818181819e.Calculate and report the mean age for your random sample of 10 students. The sample mean age is23.5years.f.Identify the type of sampling method you have just used:This is an example of simple random sampling.g. REPEAT the random sample selection process three more times. Calculate and report the mean age for eachrandom sample of 10 students.N12345678910ID5906324272329943337711549741AGE (yrs)19193520202520241820ii)The sample mean age is22years.N12345678910ID3441697546976865646372493570AGE (yrs)19221818191919225822iii)The sample mean age is23.6years.N12345678910

Page 4

MATH 1530 Capstone Technology Project Summer 2015 - Page 4 preview image

Loading page ...

Name:E number:Math 1530 section numberID62729220921240628140419704331AGE (yrs)19214820192118211819iv)The sample mean age is22.4years.h. Supposewe think ofallthe students who responded to the survey as apopulationfor the purposes of thisproblem.In that case, thepopulation meanage is 21.293. Discuss (two or morecomplete sentences) thedifferences and similaritiesbetween 21.293 and the answers you got in (b), (e), and ii), iii), and iv).The samples we have collected in (b), (e), and ii), iii), and iv) are just a part of the complete population data. Thus theobtained samples means may or may not be exactly equal to the population mean, here we can see that the samplemeans are very close to the population mean but not exactly equal.The samples means thus can be considered asan estimate of the population mean.Problem 3(h):FLIP A COIN. Circle the outcomeheads / tails.If you got ‘heads,’ then do this problem.(Omit this page/problem if you got ‘tails.)Question10of theSPRING 2015survey asked students, “How much money did you spend on your last clothingpurchase? (in US dollars)a.Create an appropriate graph to display thedistributionof the variablecalledCLOTHING PURCASEand insert ithere.The obtained graph is given below,b.Which of the following best describes the shape of the distribution? Underline your answer.Skewed leftSymmetricSkewed rightc.Using Minitab, calculate the basic statistics for the data collected onCLOTHING PURCASE. Copy andpasteallofthe Minitab output here.$1,800.00$1,500.00$1,200.00$900.00$600.00$300.00$0.005004003002001000CLOTHINGPURCHASEFrequencyHistogramofCLOTHINGPURCHASE

Page 5

MATH 1530 Capstone Technology Project Summer 2015 - Page 5 preview image

Loading page ...

Name:E number:Math 1530 section numberDescriptive Statistics: CLOTHING PURCHASEVariableNN*MeanSEMeanStDevVarianceCoefVarMinimumQ1MedianCLOTHINGPURCHASE795565.393.84108.2011707.90165.480.0020.0036.00N forVariableQ3MaximumRangeIQRModeModeSkewnessKurtosisCLOTHINGPURCHASE75.002000.002000.0055.0020969.05136.14d.Choose statistics that are appropriate for the shape of the distribution to describe the center and spread ofCLOTHING PURCASE.Which statistic will you use to describe the center of the distribution? (Median)e.What is the value of that statistic? (36)f.Which statistic(s) will you use to describe the spread of the distribution?Range or IQR.g.What is (are) the value(s) of that (those) statistic(s)?Range = 2000 and IQR = 55h. Look up the IQR rule on p.50 in our textbook.Are there any outliers in this distribution? If so, what are theirvalues? How many are there?Justify your answer.Using IQR rules,Acceptable lower limit = Q1-1.5*IQR = 20-1.5*55 =-62.50As all values are above this limit so there are no outliers on the lower side.Acceptable upper limit = Q3+1.5*IQR = 75+1.5*55 = 157.5There are 70 values above this acceptable limit and all of them are outliers.Problem 3(t):YOU JUSTFLIPPED A COIN. If you got ‘tails,’ then do this problem.(Omit this page/problem ifyou got ‘heads.)Question12of theFALL 2014survey asked students, “Usually, how many hours sleep do you get in a night?Thedata is incolumn 14‘SLEEP’of the data file.

Page 6

MATH 1530 Capstone Technology Project Summer 2015 - Page 6 preview image

Loading page ...

Name:E number:Math 1530 section numbera.Create an appropriate graph to display thedistributionof the variablecalledSLEEPand insert it here.The obtained graph is given below,b.Which of the following best describes the shape of the distribution? Underline your answer.Skewed leftSymmetricSkewed rightc.Using Minitab, calculate the basic statistics for the data collected onSLEEPand copy & paste the Minitab outputhere.The obtained output is given below,Descriptive Statistics: SLEEPVariableNN*MeanSEMeanStDevMinimumQ1MedianQ3MaximumSLEEP118406.58530.03871.33282.00006.00007.00008.000014.0000d.Choose statistics that are appropriate for the shape of the distribution to describe the center and spread ofSLEEP.i)Which statistic will you use to describe the center of the distribution? (Mean)ii)What is the value of that statistic? (6.5853)iii)Which statistic(s) will you useto describe the spread of the distribution?Standard deviation1412108642350300250200150100500SLEEPFrequencyHistogramofSLEEP
Preview Mode

This document has 17 pages. Sign in to access the full document!