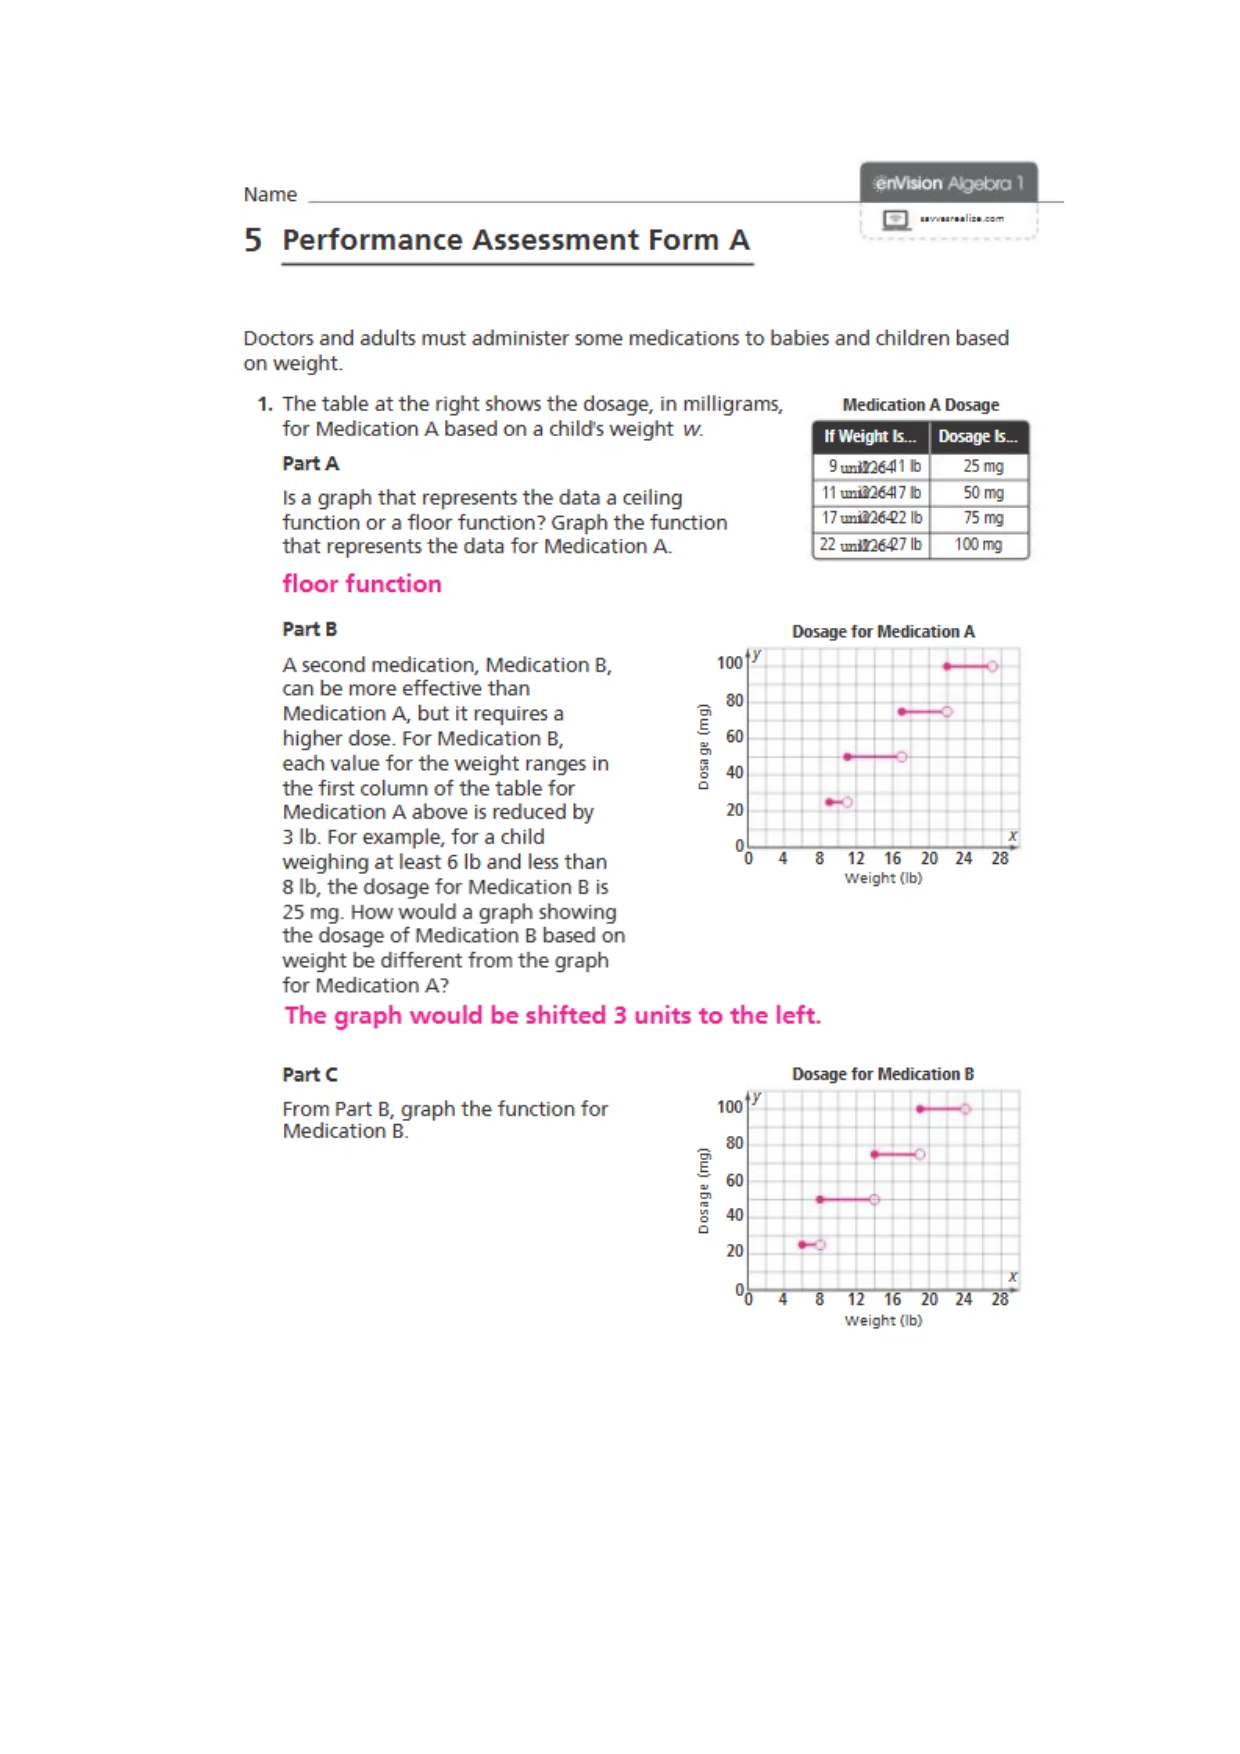
 erwisjon1Name5Performance Assessment Form ADoctors and adults must administer some medications to babies and children basedon weight.1.The table at the right shows the dosage, in milligrams,Medication A DosageforMedication A based on a child's weight w.Part AIs a graph that represents the data a ceilingfunction or a floor function? Graph the functionthat represents the dataforMedication A.floor functionPart EDosage for Medication Aif Weight is...Dosage ts...9 I i n w m1 lb25 mg11 untf2G417 lb50 mg17imit26422 lb75 mg22 imCTSiA£7 lb100 mgA second medication, Medications,can be more effective thanMedication A, but it requires ahigher dose. For Medication B,each value for the weight ranges inthe first column of the table forMedication A above is reduced by3 lb. For example, for a childweighing at least 6 lb and less than8 lb, the dosage for Medication B is25 mg. How would a graph showingthedosage of Medication B based onweight be differentfromthegraphforMedication A?The graph would be shifted 3Dosa ge (mg)x28“812162024Weight (lb)units to the left.Part CDosage for Medication BFrom Part B, graph thefunction for100Medication B.„8U6040Dosage (mgj2048121620Weight (lb)x2428‘
Preview Mode
This document has 2 pages. Sign in to access the full document!