

Operations Management, (Mcgraw-hill Education Operations and Decision Sciences) 1st Edition Solution Manual
- Operations Management
- 153 pages
- Shared February 2025
- 91 downloads
Make studying easier with Operations Management, (Mcgraw-hill Education Operations and Decision Sciences) 1st Edition Solution Manual, designed for clear and structured learning.
Preview 31 of 153 pages
See the first 31 pages exactly as they appear in the document.
Page 1 Read page 1 as text
1 CHAPTER 1 INTRODUCTION TO OPERATIONS MANAGEMENT CONCEPTUAL QUESTIONS 1 . Answer : Slogan A emphasizes Fit ; Slogan B emphasizes Timing ; Slogan C emphasizes Price ; Slogan D emphasizes Location ; and Slogan E emphasizes Performance . 2 . Answer : D. Customer Satisfaction 3 . Answer : False 4 . Answer : False 5 . Answer : Yes 6 . Answer : C. Fatigue 7 . Answer : B. How much do we pay the CEO? PROBLEMS AND APPLICATIONS 1 . Answer : C. Location and Time
Page 2 Page 3 Read page 3 as text
2 2 . Answer : B . Fit . Feedback : Fit is a subcomponent of the consumption utility that captures how well the product or service matches with the unique characteristics of a given consumer. 3 . Answer : A. Performance . Feedback : Performance is a subcomponent of the consumption utility that captures how much an average consumer desires a product or service. 4 . Answer : D. Timing. Feedback : The "to - go" section is designed for customers to purchase food quickly and move on their way to their departure gate. The primary focus is on the speed of service, which addresses the timing element of the customer utility function. 5 . Answer : A. Performance. Feedback : The "special edition" coupe has features that give it a higher level of performance compared to the standard model. As a result, the "special edition" vehicle clearly emphasizes the performance dimension of the customer utility function. 6 . Answer : Hotels B, C, and D. Feedback : The only hotel that is Pareto dominated is hotel A - all other are on the efficient frontier. Hotel A is Pareto dominated by hotel B, as B is both cheaper and better. 7 . Answer : Carriers A, B, and C. Feedback : Carrier D is the only one not on the efficient frontier because it is dominated by Carrier A on both measures.
Page 4 Read page 4 as text
3 8 . Answer : Dry Cleaner B . Feedback : Dry Cleaner B is the only one not on the efficient frontier because it is dominated by both Dry Cleaner A and C on both measures. 9 . Answer : C. Empty bottles . Feedback : The bottle is a part of the soft drink product. 10 . Answer : B. Bottling machines . Feedback : The bottling machine is a resource used to manufacture the soft drinks. The other items are inputs and are part of the product. 11 . Answer : C. Feedback : The only item in the list that is a material used in the doctor's office operations is a needle. The rest of the items would be considered resources. 12 . Answer : B. Feedback : The only item in the list that is used to transform inputs to outputs is the projector. The rest of the items in the list would be classified as inputs because they are materials and supplies used in the operations. 1 3 . Answer : D. Feedback : Employee work schedules set a week in advance 1 4 . Answer : C. Feedback : Customers incorrectly list information on forms
Page 5 Read page 5 as text
4 1 5 . Answer : A and D. Feedback : Convenience refers to the questions of “when” and “where” the demand will be fulfilled. 1 6 . Answer : B. Feedback : The operational efficiency will affect the price that the firm is able to charge for its product and service to maximize its profitability. 1 7 . Answer : C. Feedback : The product or service characteristics will affect how much each consumer will like the overall product or service, which is measured by consumption utility. CASE There is no case for this chapter.
Page 6 Read page 6 as text
1 CHAPTER 2 INTRODUCTION TO PROCESSES CONCEPTUAL QUESTIONS 1 . Answer: C. Number of customers. Feedback: The number of workers, cash registers, and suppliers are unlikely to change much over the course of a month and do not “flow” through the process of the hardware store. 2 . Answer: D. The number of patients. Feedback: Physicians, beds, and square footage are unlikely to change much over the course of a month and do not “flow” through the process of a hospital. 3 . Answer: The flow rate is 1,000 passengers per day and the flow time is 5 days. 4 . Answer: The inventory is 15 voters. Feedback: The flow rate is 1,800 / 10 = 180 per hour, or 180 / 60 = 3 per minute. The flow time is 5 minutes. 5 . Answer: B. Feedback: The flow rate into a process must equal the flow rate out of a process. 6 . Answer: False. Feedback: Little’s Law applies even if there are fluctuations in inventory, flow rates, and flow times.
Page 7 Read page 7 as text
2 PROBLEMS AND APPLICATIONS 1 . Answer: D. Feedback: The number of customers is the appropriate flow unit for process analysis. The employees are resources, and the other two measures are unlikely to change from week to week. 2 . Answer: B. Feedback: The number of tax returns completed each week reflects the main operation of the accounting firm during tax season. The accountants are resources; the customers with past - due invoices reflect the accounts receivable process and not the main operation; and the reams of paper received are a result of the firm’s purchasing policies and not necessarily the main operation. 3 . Answer: A and D are correct Feedback: T he gasoline pumps and employees are resources, not flow units. 4 . Answer: 0.4 callers per minute Feedback: 8 calls divided by 20 minutes = 0.4 calls per minute. 5 . Answer: 4 minutes Feedback: To calculate the flow time of the callers, subtract the callers departure time from his or her arrival time. 32 total minutes divided by 8 callers = 4 minutes. 6 . Answer: 0.1667 customers per minute Feedback: Flow rate = 10 customers divided by 60 minutes = 0.1167. 7 . Answer: 8.6 minutes
Page 8 Read page 8 as text
3 Feedback: To calculate the flow time of the customers, subtract the customers departure time from his or her arrival time. 86 total minutes divided by 10 customers = 8.6 minutes. 8 . Answer: 4 minutes Feedback: To solve this problem, use Little’s Law. Inventory = Flow rate × Flow time. 10 people in line (average inventory) = 2.5 flow rate x flow time Flow time = 4 minutes The flow rate is 300 customers divided by 120 minutes = 2.5 9 . Answer: 90,000 wafers Feedback: 100 per second x 60 seconds per minute x 15 minutes = 90,000 10 . Answer: 360 skiers Feedback: 1,800 skiers divided by 60 minutes per hour (flow rate) x 12 minutes (flow time) = 360 skiers 11 . Answer: 8,539 visitors Feedback: Flow rate = 3,400,000 visitors divided by 365 days = 9,315.07 visitors per day Flow Rate = 22 hours/ 24 hours per day = .9167 day Inventory = 9,315.07 (flow rate) x 0.9167 (flow time) = 8539.12 visitors per day 12 . Answer: 900,000 patients Feedback: 6 months (flow time) x 150,000 new patients per month = 900,000 patients 13 . Answer: 20 chat sessions Feedback: Flow rate = 240 chats divided by 30 employees = 8 Flow time = 5 minutes divided by 60 minutes = 0.833 hour
Page 9 Read page 9 as text
4 Inventory = Flow Rate x Flow Time, 8 x 0.833= 0.6667 x 30 employees = 20 chats 14 . Answer: 840 units Feedback: 4,200 units divided by (12 minutes/60 minutes) = 840 units 15 . Answer: 120 skiers Feedback: 1,200 beds divided by 10 days = 120 new skiers per day. 16 . Answer: 7.5 minutes Feedback: To solve this problem, use Little’s Law. Inventory = Flow rate × Flow time. 30 people in line (average inventory) = 240 customers/ 60 minutes (flow rate) x flow time . Flow time = 7.5 minutes 17 . Answer: 8 years Feedback: 120 associates = 15 new employees x flow time. Flow time = 8 CASE Although the analysis of the case is relatively simple, the intuition is not always easy to grasp – many students will intuitively believe that the capacity of the faster lift should be greater than the capacity of the slower lift. The main lesson in this case is to get students to understand why that intuition is not correct. To begin the case discussion, ask the students their opinion as to who is correct, Mark (unloading capacity should be twice as high on the detachable lift) or Doug (the unloading capacity should be the same on the two lifts). Hopefully there are students who support each opinion. To resolve the question, begin with the simple process flow diagram:
Page 10 Read page 10 as text
5 Ask the question “Do all of the skiers that get on the lift at the bottom get off the lift at the top?” Of course, the answer is “We would hope so!”. So “What does that mean about how the rate of skiers getting on the lift, R on , is related to the rate of skiers getting off the lift, R off ?” And the answer there must be that they are equal! If the rate on where faster than the rate off, the number of people on the lift would grow and grow and grow. We know that can’t happen. Similarly, if the rate off exceeded the rate on, then the number of people on the lift would shrink and shrink and shrink, leaving the lift eventually with nobody. Which also doesn’t happen. So we can add to our process flow diagram: Now it is time to compare the two lifts. We can draw the process flow for each of them, emphasizing that the rate on for each must equal the rate off: Lift Skiers Skiers Lift Skiers Skiers R on R off = Slow Lift R s R s Fast Lift R f R f
Page 11 Read page 11 as text
6 Now ask students “How can we compare the rates across the two types of lifts?” The answer is given in the case – we are told that the rate skiers load onto the slow (fixed grip) lift is the same as the rate they load onto the fast (detachable) lift. That means that R s = R f . And that means that the rates that they onload skiers at the top must be the same! Thus, Doug is correct – both lifts have the same capacity to unload skiers at the top even though one is faster than the other. And this brings us to Jessica’s question – so what is the difference between the two lifts? If you ask students this question, the likely first response is that skiers spend less time on the faster lift. And that is correct. But are there other differences? Actually, there are two additional differences worth mentioning. The first comes from Little’s Law and the 2 nd one requires a deeper understanding of this process. The first obvious difference is the number of skiers on the lift. According to Little’s Law, I = R x T. So if the two lifts have the same R, but the faster lift has a smaller T, then the faster lift must have a smaller I as well: Slow Lift R s R s Fast Lift R f R f = = Fast Lift T f = seconds on lift I f = # of skiers R R T f < T s I f = R x T f < R x T s = I s
Page 12 Read page 12 as text
7 So fewer people are on the faster lift and they spend less time on the lift but the faster lift and the slower lift bring skiers to the top at the same rate. If students can’t get the next difference between the two lifts, then you can prompt them with the following question “If the faster lift has fewer skiers than the slower lift, then where are the additional skiers?” Or put another way: “If the ski area attracts a certain number of skiers but the faster lift has fewer skiers on it, then where are the other skiers?” The answer is that they are on the slopes! That means that adding a faster lift takes skiers off the lift but they don’t disappear. Instead, they are on the only other place they can be, the slopes. Which means, somewhat counter - intuitively, that adding a faster lift makes the slopes more crowded (holding the total number of skiers fixed).
Page 13 Read page 13 as text
1 CHAPTER 3 PROCESS ANALYSIS CONCEPTUAL QUESTIONS 1 . Answer : B. How long does it take the office to process an application? 2 . Answer : D. Chefs 3 . Answer : C. Paying the bill 4 . Answer : B. They are reciprocals of each other. 5 . Answer : A. Capacity constrained 6 . Answer : C. The cycle time 7 . Answer : D. 1.00 8 . Answer : B. Equal to 9 . Answer : A. Machine - paced 10 . Answer : B. Shorter than the average flow time
Page 14 Read page 14 as text
2 PROBLEMS AND APPLICATIONS 1 . ( a ) Answer : 4 customers per hour Feedback : 60 minutes/15 minutes = 4 customers per hour ; ( b ) Answer : 2 customers per hour ( c ) Answer : 50 percent Feedback : 2 demand / 4 capacity = 50% ; ( d ) Answer : 30 minutes per customer Feedback : Cycle time = 1/flow rate, 2/ 60 minutes= 30 minutes per customer 2 . ( a ) Answer : 72 visits per 9 hour work day Feedback : 12 nurses × 9 hours/1.5 hours per visit = 72 visits; ( b ) Answer : 83 percent Feedback : 60 demand/ 72 capacity = 83 utilization; ( c ) Answer : 9 minutes per pat ient Feedback : (9 hours × 60 minutes) / 60 patients = 9.0 minutes per patient 3 . (a)
Page 15 Read page 15 as text
3 (b) Answer : 0.333 units per minute Feedback : 1 unit / 3 minutes per unit = 0.333 units per minute. (c) Answer : Resource 1 Feedback : Resource 1 has the longest processing time. (d) Answer : 50% Feedback : Demand = 60 minutes / 6 minutes Resource 1bottleneck = 10 units, Capacity 60 minutes / 3 minutes = 20 units Utilization = 10 units / 20 units = 50% (e) Answer : 1,208 minutes Feedback : 200 units × 6 minutes Resource 1 + 3 minutes Resource 2 + 5 minutes Resource 3 = 1,208 minutes. 4 . (a) (b) Answer : 1,200 bottles per hour (c) Answer : Packaging (d) Bottling Apply a Lid Labeling Packaging
Page 16 Read page 16 as text
4 Answer : 900 bottles per hour (e) Answer : 75% (f) Answer : 1,996 + 16 = 2,012 seconds 5 . a) (b) Answer : 20 patients per hour Feedback : 10 workers × (60 minutes per hour/30 minutes per patient) = 20 patients per hour. (c) Answer : T he dental assistants Feedback : The dental assistants have the lowest capacity of 12 patients per hour, 3 dental assistants × (60 minutes per hour/ 15 minutes per patient) = 12 patients per hour. (d) Answer : 12 patients per hour Feedback : The Flow Rate = 12 patients per hour, 3 dental assistants × (60 minutes per hour/ 15 minutes per patient) = 12 patients per hour. (e) Answer : 50% Feedback : Receptionists capacity = 2 receptionists × (60 minutes per hour/5 minutes per patient) = 24 patients per hour. Self - Serve Receptionist Dental Assistant Dentist
Page 17 Read page 17 as text
5 Utilization = 12 patients per hour at the bottleneck/24 patients per hour capacity = 50% (f) Answer : 1 0 0 minutes Feedback : [(5/2) at bottleneck x 20] + 5 Self - Serve + 15 Dental Assistant + 30 Dentist = 100 minutes. 6 . (a) Answer : 5 batches per hour Feedback : Since there is only one machine at each process step, the capacity is the reciprocal of the activity time. The capacity of the baking process step is 1 / 12 batches per minute * 60 minutes per hour = 5 batches per hour. (b) Answer : Cooling Feedback : S ince there is only one machine at each process step, the bottleneck is the step with the most work to do. (c) Answer : 3.33 batches per hour Feedback : The process flow rate is the capacity of the bottleneck , which is the cooling process. The process flow rate is 1 / 18 batches per minute * 60 minutes per hour = 3.33 batches per hour. (d) Answer : 83 percent Feedback : The capacity of the mixing process step is 1 / 15 batches per minute * 60 minutes per hour = 4 batches per hour. The process flow rate is 3.33 batches per hour. The utilization is the flow rate divided by the capacity of the process step = 3.33 batches per hour / 4 batches per hour = 83%. (e) Answer : 15 hours to complete 50 batches. Feedback : The time to complete X units in a full system is X * Cycle time. The cycle time is 1 / 3.33 hours, so it takes 50 / 3.33 = 15 hours to complete 50 batches.
Page 18 Read page 18 as text
6 7 . (a) Answer : Office managers Feedback : T he capacity of each resource is the number of employees / activity time. The capacity for the office managers is 2 / 4 = 0.50 loans per hour, which is less than the capacities of either of the other two resources. (b) Answer : 20 loans per week Feedback : The flow rate is the capacity of the bottleneck, which is 2 / 4 = 0.50 loans per hour * 8 hours per day * 5 days per week = 20 loans per week. (c) Answer : 90 percent Feedback : If the demand is 18 loans per week, this is the process flow rate because it is lower than the process capacity. The utilization of the office managers’ resource is Flow rate / Resource capacity = 18 loans per week / 20 loans per week = 90%. (d) Answer : 30 hours Feedback : This is a worker - paced process, so the first loan will take 1 + 7 + 4 = 12 hours to complete. The remaining loans have a cycle time of 1 / 0.50 = 2 hours per loan. This means that the remaining loans will take an additional 9 * 2 = 18 hours to complete. The total time to complete 10 loans is 12 + 9 * 2 = 30 hours. 8 . Answer : 54 hours Feedback : Step 3 is the bottleneck step of the process, so the machine - paced process will be set at a speed of 1/2 hour per unit at each step. The first unit will take 4 * 1/2 = 2 hours to complete. The remaining 104 units will have a cycle time of 1/2 hour. The total time required to complete a batch of 105 units is 2 + 104 * 1/2 = 54 hours. 9 . Answer : 12 8 minutes to serve 20 customers Feedback : The bottleneck is the first step of the process, which means that the cycle time for all customers other than the first one is 5 minutes. The first customer takes
Page 19 Read page 19 as text
7 5 + 15 + 10 + 3 = 33 minutes to complete service. As a result, it takes a total of 33 + 19 * 5 = 128 minutes to serve 20 customers. 10 . (a) Answer : 12 customers per hour Feedback : The bottleneck is the Wash process, with a capacity of 12 cars per hour. The flow rate is the minimum of the capacity of the bottleneck and the demand. (b) Answer : 60 percent Feedback : Utilization is the flow rate divided by the capacity of the process step. If the demand is 15 cars per hour, the flow rate is 12 cars per hour, because the flow rate is the minimum of the capacity of the bottleneck and the demand. The capacity of the machine that performs the Wax process is 1 / 3 * 60 = 20 cars per hour. The utilization of this machine is 12 / 20 = 60%. 11 . (a) Answer : 12 per hour Feedback : The bottleneck resource is the license processing station. Each machine can process 4 customers per hour, and there are three machines; thus, the flow rate through this stage (and the process as a whole) is 12 customers per hour. All of the other steps have higher capacities. (b) Answer : 15 per hour Feedback : The current bottleneck is the license processing station. Each machine has a capacity of 4 customers per hour, so adding one machine would increase the capacity of this station to 16 customers per hour. The cashiers each have a capacity of 7.5 customers per hour, so the capacity of this resource is only 15 customers per hour. The cashiers will now be the bottleneck, and the process flow rate is 15 customers per hour.
Page 20 Read page 20 as text
8 CASE The chapter’s ‘Connection side - box’ showcases the Tesla plant. The key goal of this mini - case is that students learn how to take a complex process as shown in the video and then abstract this information to something simple as a process flow diagram. The process flow diagram can take various forms / there does not exist a uniquely right answer. We suggest a diagram such as the following: As far as the calculations are concerned: Cycle time: the process operates for 80 hours per week. It produces 500 cars per week. So, the cycle time is 80 hours / 500 cars = 0.16 hours/car = 9.6 minutes/car The flow time of the process is the 3 - 5 days it takes a car to journey through the process Inventory can exist between steps and at the beginning as raw materials. However, most of the inventory is likely to sit in each of the boxes as work in process inventory. This includes many cars that are half assembled as well pieces of metal that are waiting to be joined together. The total inventory is I = R*T = 100 cars per day * 4 days = 400 cars.
Page 21 Read page 21 as text
1 CHAPTER 4 PROCESS IMPROVEMENT CONCEPTUAL QUESTIONS 1 . Answer : A. Costs of direct labor would be 50% lower 2 . Answer : B. The labor content stays the same 3 . Answer : A. The idle time would decrease 4 . Answer : B. No 5 . Answer : A. True 6. Answer : A. Takt time only depends on demand, not capacity. Cycle time does depend on capacity. 7 . Answer : A. True 8 . Answer : C. The takt time decreases 9 . Answer : A. The target manpower increases 10 . Answer : B. The target manpower doubles
Page 22 Read page 22 as text
2 11 . Answer : C. Increasing wages for production workers 12 . Answer : B. False 13 . Answer : B. False 14 . Answer : B. False 15 . Answer : A. True 16 . Answer : B. Large Feedback : Low variable costs result in a high unit margin, so every additional customer yields a significant contribution to profitability. 17 . Answer : A. Small Feedback : High variable costs result in a low unit margin, which reduces the impact of each additional customer on profitability. 18 . Answer : B. False Feedback : Efficiency can result in higher revenue as well because the operation can serve more customers. PROBLEMS AND APPLICATIONS 1 . Answer : $800 per customer Feedback : The Direct Labor cost is (8 hours × $200 per hour)/2 customers = $800 per customer.
Page 23 Read page 23 as text
3 2 . (a) Answer : $3.60 per unit Feedback : Resource 1 is the bottleneck center at 6 minutes per unit. The Direct Labor cost is (6 minutes per resource × 3 resource centers/60 minutes per hour) × $12 per hour = $3.60 (b) Answer : 14 minutes per unit Feedback : Labor content = 6 minutes Resource 1 + 3 minutes Resource 2 + 5 minutes Resource 3 = 14 minutes (c) Answer : 1 minute per unit Feedback : The idle time at Resource 3 = 6 minutes Resource 1 (bottleneck) – 5 minutes Resource 3 = 1 minute idle time (d) Answer : 77.78 percent Feedback : Labor Utilization = 14 demand/18 capacity = 77.78% (e) Answer : 3 minutes per unit Feedback : Takt Time = 1/Demand rate = 1/(20 cu stomers/60 minutes) = 3 minutes (f) Answer : 4.67 minutes per unit Feedback : The target manpower = 14 Labor Content/3 minutes Takt Time = 4.67 3 . (a) Answer : 50 minutes per patient (b) Answer : $95.83 per patient Feedback : $1,150 per hour / 12 patients per hour = $95.8 3 per patient 4 . (a) Answer : 60 minutes per customer
Page 24 Read page 24 as text
4 Feedback : Labor content = 10 minutes Activity 1 + 10 minutes Activity 2 + 10 minutes Activity 3 + 25 minutes Activity 4 + 5 minutes Activity 5 = 60 minutes (b) Answer : 66.67 percent Feedback : 60 minutes labor content / (3 employees x 30 minutes bottleneck) = 66.67% (c) Answer : $30 per customer Feedback : $60 per hour / 2 customers per hour = $30 per customer (d) Answer : $26.67 per customer Feedback : $80 per hour / 3 customers per hour = $26.67 per customer (e) Answer : $25 per customer Feedback : $60 per hour / (60/25) customers per hour = $25 per customer 5 . (a) Answer : 395 seconds per watch Feedback : Labor content = 68 seconds Station A + 60 seconds Station B + 70 seconds Station C + 58 seconds Station D + 75 seconds Station E + 64 second Station F = 395 seconds (b) Answer : 72 seconds per watch Feedback : Takt Time = 1/Demand rate = 1/(50 watches/3600 seconds per hour)= 72 seconds (c) Answer : 5.49 workers Feedback : 395 / 72 = 5.49 (d) Answer : 0.0 watches per hour Feedback : There is no impact. (e) Answer : D. Move cosmetic inspection (step 14) to station D 6 . (a) Answer : $1.25 per unit Feedback : 5 * 15 / 60 = $1.25 per unit (b) Answer : $25 per hour
Page 25 Read page 25 as text
5 Feedback : Revenues are $360 per hour and costs are $335 per hour so profits are $25 per hour. (c) Answer : $31 per hour Feedback : Savings = 60 units per hour x $0.10 = $6.00. $6.00 savings + $25 per hour (see part B) = $31.00 (d) Answer : $45 per hour Feedback : $20 fixed cost savings + $25 (see part B) = $45 per hour. (e) Answer : $52.27 per hour Feedback : It now takes 55 seconds to make each unit. 3600 seconds per hour divided 55 seconds per unit = 65.4545 units. Revenues are $392.73 - $65.46 parts - $75 labor - $200 fixed coast = 52. CASE The mini - case for this chapter is the Xootr manufacturing process. The process flow diagrams are as follows: We compare the two proposals assuming that there are no benefits of specialization. Proposal Specialized One worker does it all Number of workers 6 6 Wages per hour 6*12 6*12 Processing times 6.5., 6.5, 5.5, 5.5, 4, 4 32 Bottleneck First resource First resource
Page 26 Read page 26 as text
6 Capacity 1/6.5 units per minute 6/32 units per minute Cost of direct labor 72 / (60/6.5) 72 / (6/32) Idle time 0, 0, 1, 1, 2.5, 2,5 0 Labor content 32 minutes per unit 32 minutes per unit Labor utilization =32/(32+7) 1 Variables that might differ: the question is if it would be possible to cut the processing times reflecting specialization gains in the first proposal. Also, the first proposal could be improved if the line could be better balanced
Page 27 Read page 27 as text
1 CHAPTER 5 PROCESS ANALYSIS WITH MULTIPLE FLOW UNITS CONCEPTUAL QUESTIONS 1 . C. 6 2 . A. 2 3 . A. True 4 . B. False. This really depends on the available capacity. 5 . B. False. When demand exceeds capacity, the implied utilization is bigger than 100%. 6 . A. True 7 . C. 40 / 0.5 = 80 units per day 8 . B. 100% 9 . B. False. We have to also look at the demand matrix. 10 . C. The yield decreases. 11 . D. Minutes or hours of work
Page 28 Read page 28 as text
2 12 . A. True 13 . A. True 14 . B. False 15 . D. Scrap is a special case of rework in which flow units have to repeat all resources in the process up to the defect. 16 . A. True PROBLEMS AND APPLICATIONS 1 . (a) Answer : 50 per week (b) Answer : 10 per week (c) Answer : 40 per week Feedback : We use the first two steps from Figure SUM1. Step 1: Compute the demand matrix (Group 1) (Group 2) (Administrator) 0.2 * 50 0.8 * 50 D = (Senior ac.) 0.2 * 50 0 (Junior ac.) 0 0.8 * 50
Page 29 Read page 29 as text
3 Step 2: Compute the total demand rates, which are 50 per week for the administrator, 10 for the senior accountant, and 40 for the junior accountant. 2 . (a) Answer : Administrator Feedback : We continue with Step 3 in Figure SUM1. Step 3: We compute the capacity levels as follows: Administrator: 1/20 units / minute = 3 units per hour = 120 units per week Senior accountant: 1/40 units / minute = 1.5 units per hour = 60 units per week Junior accountant: 1/15 units / minute = 4 units per hour = 160 units per week Step 4: The levels of implied utilization are: Administrator: 50 units per week / 120 units per week = 0.4166 Senior accountant: 10 units per week / 60 units per week = 0.1667 Junior accountant: 40 units per week / 160 units per week = 0.25 So the administrator is the bottleneck. (b) Answer : The flow rate 10 new cases per week and 40 repeat customers per week; the capacity for new customers is 24 cases per week and for repeat customers is 96 cases per week Feedback : Step 5: The process is demand constrained and thus the flow rates are the demand rates, 10 new cases per week and 40 repeat customers per week. The capacity levels are found by dividing the demand rates by the highest implied utilization. Thus, the capacity of this process with a 20:80 mix would be: New customers: 10 / 0.4166 = 24 cases per week Repeat customers: 40 / 0.4166 = 96 cases per week 3 . (a) Answer : The written exam Feedback : We follow the 4 - step process outlined in Figure SUM2. Step 1: We find the demand matrix by starting with one good unit (a student that passes). Given the 40% failure rate, we need 1 / 0.6 = 1.67 students to take the road
Page 30 Read page 30 as text
4 exam to get one succeed. In the same way, we compute that we need 1.667/ 0.85 = 1.96 students to take the written exam, and 1.96 / 0.9 = 2.18 students to show up. So the demand matrix is: (ID) (2.18) D = (Written) (1.96) (Road) (1.67) Step 2: The capacity levels are simply computed as the number of workers divided by the processing times: Capacity(ID) = 4/5 units / minute = 384 units per day Capacity(Written) = 2/3 units / minute = 320 units per day Capacity(Road) = 15/20 units / minute = 360 units per day Step 3: Compute the levels of implied utilization IU(ID) = 2.18 / 0.8 = 2.72 IU(Written) = 1.96 / 0.67 = 2.94 IU(Road) = 1.67 / 0.75 = 2.22 So the bottleneck is at the written exam. (b) Answer : 163 good units per day Feedback : Step 4: Find the capacity of the process in terms of good units by dividing 1 good unit of output by the highest implied utilization: Capacity(ID) = 1 / 2.94 = 0.34 good units per minute = 163.2 good units per day 4 . We use the 5 - step process outlined in Figure SUM3. (a) Answer : Resource 3 Feedback : Step 1: Compute the work - load matrix (Type A) (Type B) (Type C) (Resource 1) (40 * 5 50 * 5 60 * 5) (Resource 2) (40 * 4 50 * 4 60 * 5) WL = (Resource 3) (40 * 15 0 0) (Resource 4) (0 50 * 3 50 * 3) (Resource 5) (40 * 6 50 * 6 40 * 4) Step 2: Add up the work - loads for each resource:
Page 31 Read page 31 as text
5 Resource 1: 750 minutes per day Resource 2: 660 minutes per day Resource 3: 600 minutes per day Resource 4: 300 minutes per day Resource 5: 700 minutes per day Step 3: Compute the available time per day at each resource Resource 1: 2 * 480 = 960 minutes per day Resource 2: 2 * 480 = 960 minutes per day Resource 3: 1 * 480 = 480 minutes per day Resource 4: 1 * 480 = 480 minutes per day Resource 5: 2 * 480 = 960 minutes per day Step 4: Compute the implied utilization levels as demand rate in minutes of work divided by the available time in minutes of work: Resource 1: 750 minutes per day / 960 minutes per day = 0.78 Resource 2: 660 minutes per day / 960 minutes per day = 0.69 Resource 3: 600 minutes per day / 480 minutes per day = 1.25 Resource 4: 300 minutes per day / 480 minutes per day = 0.625 Resource 5: 700 minutes per day / 960 minutes per day = 0.73 Resource 3 is the bottleneck because it has the highest implied utilization. ( b ) Answer : The flow rate for A is 32 units per day; B is 40 units per day; and C is 48 units per day . Feedback : Step 5: The process is capacity constrained. So we have to divide all flows by 1.25: Flow A = 40 / 1.25 = 32 units per day Flow B = 50 / 1.25 = 40 units per day Flow C = 60 / 1.25 = 48 units per day 5 . We use the framework outlined in Figure SUM4. (a) Answer : Step 3 Feedback : Step 1: We compute the work - load matrix Good Rework 1 (0.7 * 5 0.3 * [5 + 5]) 2 (0.7 * 6 0.3 * [6 + 6]) WL = 3 (0.7 * 3 0.3 * [3 + 3]) 4 (0.7 * 4 0.3 * 4)
122 more pages in the full document
Unlock it once and it stays in your library, ready to chat with or turn into flashcards.
Unlock the full documentMore Operations Management study materials
See all Exam Guides
Operations Management, 1e (Mcgraw-hill Education Operations and Decision Sciences) 1st Edition Test Bank
Operations Management
488 pagesMay 2025 Textbook Guides
Solution Manual for Operations and Supply Chain Management, 14th Edition
Operations Management
342 pages133downloadsFeb 2025 Textbook Guides
Managing Quality: Integrating the Supply Chain, 6th Edition Solution Manual
Operations Management
262 pages115downloadsFeb 2025 Textbook Guides
Solution Manual For Matching Supply with Demand: An Introduction to Operations Management, 4th Edition
Operations Management
76 pages36downloadsFeb 2025 Class Notes
PROCESS DESIGNS AND SUPPLY CHAINS PART 2 - OPS/571
Operations Management
7 pagesMay 2025 Class Notes
Lecture Notes for Operations Management, 2nd Edition
Operations Management
95 pagesMay 2025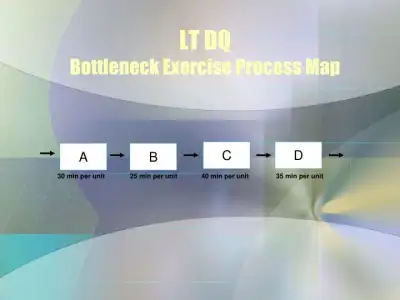 Class Notes
LT DQ Bottleneck Exercise Process Map
Operations Management
1 pageMay 2025 Textbook Guides
Solution Manual for Operations Management, 2nd Edition
Operations Management
173 pagesMay 2025
Study this document with CramX
Once it is in your library, every tool can work from it.