

BTM8107-8 Week 2 Understanding and Exploring Assumptions Correct Answers
- Statistics
- Northcentral University
- 20 pages
- Shared May 2025
Week 2 solutions on statistical assumptions and hypothesis testing.
Preview 7 of 20 pages
See the first 7 pages exactly as they appear in the document.
Page 1 Read page 1 as text
BTM8107 - 8 W eek 2 U nderstanding and Exploring Assumptions Correct Answers 1.Why do we care whether the assumptions required for statistical tests are met? (Tip: You might also want to write your answer on a note card you paste to your computer.) 2. Open the data set that you corrected in Activity #1 for DownloadFestival.sav. You will use the following variables: Day1, Day2, and Day3 (hygiene variable for all three days). Create a simple histogram for each variable. Choose to display the normal cur ve (under Element Properties) and title your charts. Copy these plots into your Word document. 3. Now create probability - probability (p - p) plots for each variable. This output will give you additional information. Read over the Case Processing Summary. Notice that there is missing data for Days 2 and Day 3. Copy only the Normal p - p Plots into your W ord document (you do not need to copy the beginning output nor the Detrended Normal p - p Plots). 4. Examining the histograms and p - p plots, describe the dataset with particular attention toward the assumption of normality. For each day, do you think the responses are reasonably normally distributed? (Just give your impression of the data.) Why or why not? 5.Using the same dataset and the Frequency command, calculate the standard descriptive measures (mean, median, mode, standard deviation, variance and range) as well as kurtosis and skew for all three hygiene variables. Paste your output into your Word docu ment (you do not need to paste the Frequency Table). What does the output tell you? You will need to comment on: sample size, measures of central tendency and dispersion and well as kurtosis and skewness. You will need to either calculate z scores for skew ness and kurtosis or use those given in the book to provide a complete answer. Bottom line: is the assumption of normality met for these three variables? Does this match your visual observations from qu estion #1? 6. Using the dataset SPSSExam.sav and the Frequency command, calculate: the standard descriptive statistics (mean, median, mode, standard deviation, variance and range) plus skew and kurtosis, and histograms with the normal curve on the following variables : Computer, Exam, Lecture, and Numeracy for the entire dataset. Complete the same analysis using University as a grouping variable. Paste your output into your Word document (you do not need to paste the Frequency Table). What do the results
Page 2 Page 3 Read page 3 as text
tell you with regard to whether the data is normally distributed? 7. Using the dataset SPSSExam.sav, determine whether the scores on computer literacy and percentage of lectures attended (with University as a grouping variable) meet the assumption of homogeneity of variance (use Levene’s test). You must remember to uncli ck the “split file” option used above before conducting this test. What does the output tell you? (Be as specific as possible.) 8. Describe the assumptions of normality and homogeneity of variance. When these assumptions are violated, what are your options? Are there cases in which the assumptions may technically be violated, yet have no impact on your intended analyses? Explain.
Page 4 Read page 4 as text
1.Why do we care whether the assumptions required for statistical tests are met? (Tip: You might also want to write your answer on a note card you paste to your computer.) Assumptions are needed to draw accurate conclusions about reality test Different assumptions are made for various statistical models and in order for models to reflect reality accurately; their assumptions need to be true . If assumptions are broken, accurate conclusions cannot be drawn about the data distribution. T herefore, part of the data process involves checking to make sure that your data doesn't fail this assumption . 2. Open the data set that you corrected in Activity #1 for DownloadFestival.sav. You will use the following variables: Day1, Day2, and Day3 (hygiene variable for all three days). Create a simple histogram for each variable. Choose to display the normal cur ve (under Element Properties) and title your charts. Copy these plots into your Word document.
Page 5 Page 6 Page 7 Read page 7 as text
3. Now create probability - probability (p - p) plots for each variable. This output will give you additional information. Read over the Case Processing Summary. Notice that there is missing data for Days 2 and Day 3. Copy only the Normal p - p Plots into your W ord document (you do not need to copy the beginning output nor the Detrended Normal p - p Plots).
13 more pages in the full document
Unlock it once and it stays in your library, ready to chat with or turn into flashcards.
Unlock the full documentMore Statistics study materials
See all Solved Assignments
BTM8107-8 Week 5 Apply ANCOVA and Factorial ANOVA Correct Answers
Statistics
5 pagesMay 2025 Solved Assignments
BTM8107-8 Week 8 Apply MANOVA and Prepare a Course Reflection Correct Answers
Statistics
15 pagesMay 2025 Solved Assignments
BTM8107-8 Non-Parametric Tests
Statistics
13 pagesMay 2025 Solved Assignments
BTM8107-8: MANOVA and Course Reflection - Northcentral University
Statistics
9 pagesMay 2025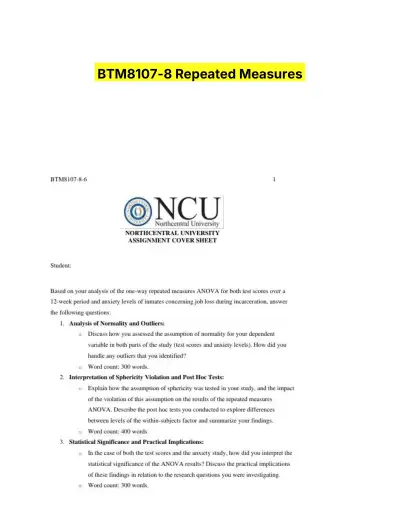 Solved Assignments
BTM8107-8 Repeated Measures
Statistics
17 pagesMay 2025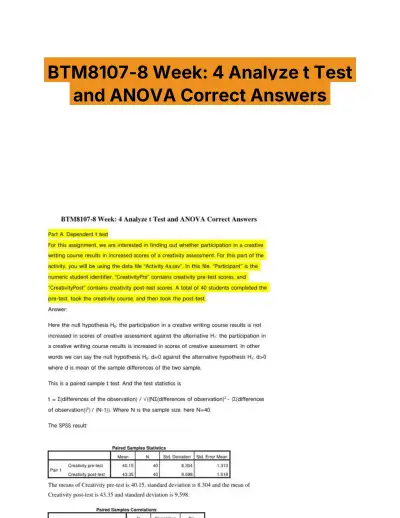 Solved Assignments
BTM8107-8 Week: 4 Analyze t Test and ANOVA Correct Answers
Statistics
7 pagesMay 2025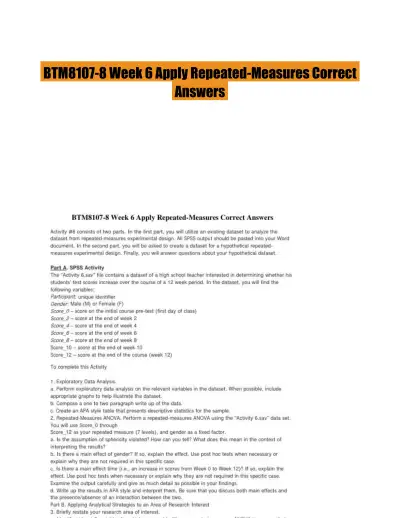 Solved Assignments
BTM8107-8 Week 6 Apply Repeated-Measures Correct Answers
Statistics
17 pagesMay 2025 Exam Guides
Test Bank for Biostatistics for the Biological and Health Sciences , 2nd Edition
Statistics
182 pages161downloadsFeb 2025
Study this document with CramX
Once it is in your library, every tool can work from it.