

BTM8107-8 Week: 4 Analyze t Test and ANOVA Correct Answers
- Statistics
- Northcentral University
- 7 pages
- Shared May 2025
Solutions for t-tests and ANOVA statistical analysis.
Preview 3 of 7 pages
See the first 3 pages exactly as they appear in the document.
Page 1 Read page 1 as text
BTM8107 - 8 Week: 4 Analyze t T est and ANOVA C orrect A nswers Part A. Dependent t test For this assignment, we are interested in finding out whether participation in a creative writing course results in increased scores of a creativity assessment. For this part of the activity, you will be using the data file “Activity 4a.sav”. In this file, “Participant” is the numeric student identifier, “CreativityPre” contains creativity pre - test scores, and “CreativityPost” contains creativity post - test scores. A t otal of 40 students completed the pre - test, took the creativity course, and then took the post - test. Answer: Here the null hypothesis H 0 : the participation in a creative writing course results is not increased in scores of creative assessment against the alternative H 1 : the participation in a creative writing course results is increased in scores of creative assessment. In other words we can say the null hypothesis H 0 : d=0 against the alternative hypothesis H 1 : d>0 where d is mean of the sample differences of the two sample. This is a paired sample t test. And the test statistics is t = Σ (differences of the observation) / √ ((N Σ (differences of observation) 2 - ( Σ (differences of observation)) 2 ) / (N - 1)). Where N is the sample size, here N=40. The SPSS result: Paired Samples Statistics Mean N Std. Deviation Std. Error Mean Pair 1 Creativity pre - test 40.15 40 8.304 1.313 Creativity post - test 43.35 40 9.598 1.518 The means of Creativity pre - test is 40.15, standard deviation is 8.304 and the mean of Creativity post - test is 43.35 and standard deviation is 9.598. Paired Samples Correlations N Correlation Sig. Pair 1 Creativity pre - test & Creativity post - test 40 .650 .000
Page 2 Page 3 Read page 3 as text
From the correlation matrix of these two variables we see that the correlation between them is 0.650 and also from the scatter plot we observe that the correlation between them is high and they are highly correlated. From the result we can see that the t value is - 2.671, corresponding to the t value, p value is 0.011 which is less than 0.05 at 5% level of significance therefore we reject the null hypothesis and accept the alternative hypothesis that the participation in a creative writing course results is increased in scores of creative assessment. Lower Upper Pair 1 Creativity pre-test - Creativity post-test -3.200 7.576 1.198 -5.623 -.777 -2.671 39 .011 Paired Samples Test Paired Differences t df Sig. (2- tailed) Mean Std. Deviation Std. Error Mean 95% Confidence Interval of the
4 more pages in the full document
Unlock it once and it stays in your library, ready to chat with or turn into flashcards.
Unlock the full documentMore Statistics study materials
See all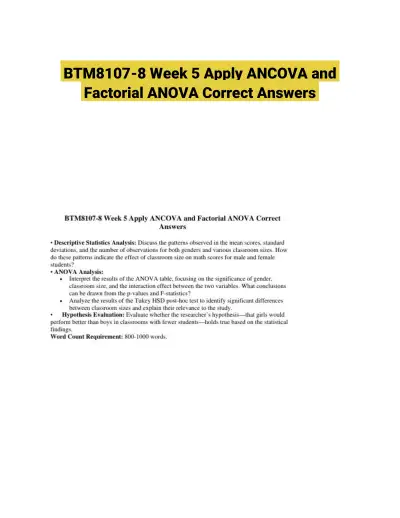 Solved Assignments
BTM8107-8 Week 5 Apply ANCOVA and Factorial ANOVA Correct Answers
Statistics
5 pagesMay 2025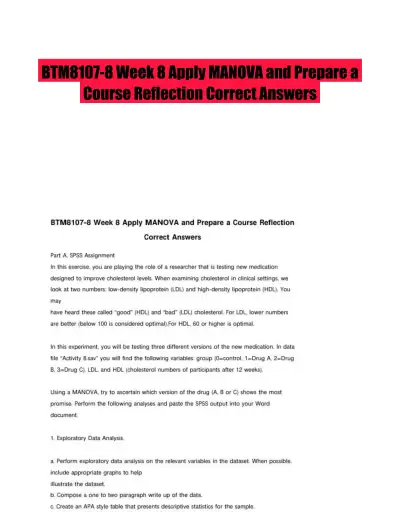 Solved Assignments
BTM8107-8 Week 8 Apply MANOVA and Prepare a Course Reflection Correct Answers
Statistics
15 pagesMay 2025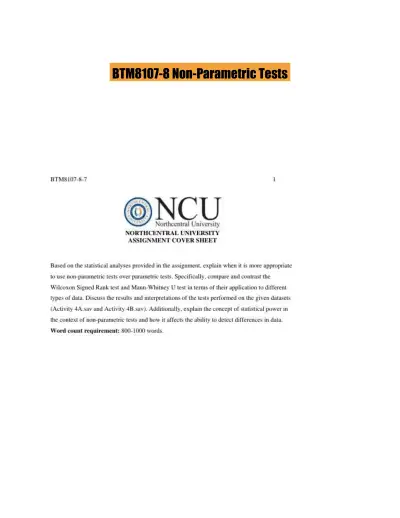 Solved Assignments
BTM8107-8 Non-Parametric Tests
Statistics
13 pagesMay 2025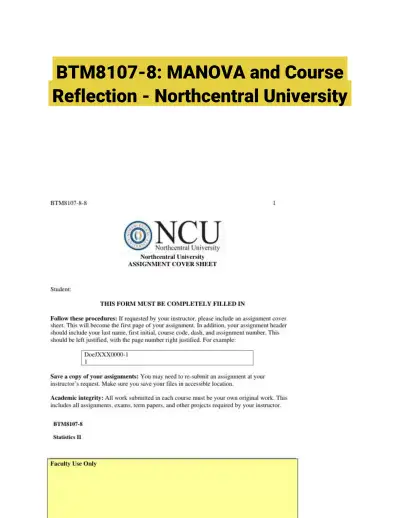 Solved Assignments
BTM8107-8: MANOVA and Course Reflection - Northcentral University
Statistics
9 pagesMay 2025 Solved Assignments
BTM8107-8 Repeated Measures
Statistics
17 pagesMay 2025 Solved Assignments
BTM8107-8 Week 6 Apply Repeated-Measures Correct Answers
Statistics
17 pagesMay 2025 Solved Assignments
BTM8107-8 Week 2 Understanding and Exploring Assumptions Correct Answers
Statistics
20 pagesMay 2025 Exam Guides
Test Bank for Biostatistics for the Biological and Health Sciences , 2nd Edition
Statistics
182 pages161downloadsFeb 2025
Study this document with CramX
Once it is in your library, every tool can work from it.