

Solution Manual For Statistics for Managers Using Microsoft Excel, 7th Edition
- Statistics
- 1418 pages
- Shared February 2025
- 158 downloads
Solution Manual For Statistics for Managers Using Microsoft Excel, 7th Edition helps you tackle difficult exercises with expert guidance.
Preview 31 of 1418 pages
See the first 31 pages exactly as they appear in the document.
Page 1 Read page 1 as text
Table of Contents Preface ................................ ................................ ................................ ................................ .... v i Teaching Tips ................................ ................................ ................................ ................................ ... 1 • levine_smume7_ism_00 - 2.doc Chapter 1 Defining and Collecting Data ................................ ................................ ............................... 38 • levine_smume7_ism_01.doc Chapter 2 Organizing and Visualizing Data ................................ ................................ ......................... 44 • levine_smume7_ism_02.doc Chapter 3 Numerical Descriptive Measures ................................ ................................ ....................... 13 0 • levine_smume7_ism_03.doc Chapter 4 Basic Probability ................................ ................................ ................................ ................ 169 • levine_smume7_ism_04.doc Chapter 5 Discrete Probability Distributions ................................ ................................ ...................... 17 7 • levine_smume7_ism_05.doc Chapter 6 The Normal Distribution and Other Continuous Distributions ................................ .......... 22 4 • levine_smume7_ism_06.doc Chapter 7 Sampling Distributions ................................ ................................ ................................ ....... 26 2 • levine_smume7_ism_07.doc Chapter 8 Confidence Interval Estimation ................................ ................................ .......................... 28 2 • levine_smume7_ism_08.doc Chapter 9 Fundamentals of Hypothesis Testing: One - Sample Tests ................................ .................. 308 • levine_smume7_ism_09.doc Chapter 10 Two - Sample Tests ................................ ................................ ................................ ............. 347 • levine_smume7_ism_10.doc Chapter 11 Analysis of Variance ................................ ................................ ................................ .......... 423 • levine_smume7_ism_11.doc Chapter 12 Chi - Square and Nonparametric Tests ................................ ................................ ................ 456 • levine_smume7_ism_12.doc Chapter 13 Simple Linear Regression ................................ ................................ ................................ .. 498 • levine_smume7_ism_13.doc Chapter 14 Introduction to Multiple Regression ................................ ................................ .................. 541 • levine_smume7_ism_14.doc Chapter 15 Multiple Regression Model Building ................................ ................................ ................. 596 • levine_smume7_ism_15.doc Chapter 16 Time - Series Forecasting ................................ ................................ ................................ ..... 646 • levine_smume7_ism_16.doc Chapter 17 A Roadmap for Analyzing Data ................................ ................................ ......................... 691 • levine_smume7_ism_17.doc
Page 2 Page 3 Read page 3 as text
Chapter 18 Statistical Applications in Quality Management (Online) ................................ ................. 789 • levine_smume7_ism_18.doc Chapter 19 Decision Making (Online) ................................ ................................ ................................ .. 823 • levine_smume7_ism_19.doc Online Sections ................................ ................................ ................................ .................. 861 • levine_smume7_ism_ols_01 Instructional Tips and Solutions for Digital Cases ................................ ............................. 896 • levine_smume7_ism_ols_02.doc The Brynne Packaging Case ................................ ................................ .............................. 931 • levine_smume7_ism_ols_03.doc The CardioGood Fitness Case ................................ ................................ ........................... 933 • levine_smume7_ism_ols_04.doc The Choice Is Yours/More Descriptive Choices Follow - up Case ................................ .... 1057 • levine_smume7_ism_ols_05.doc The Clear Mountain State Student Surveys Case ................................ ............................. 1145 • levine_smume7_ism_ols_06.doc The Craybill Instrumentation Company Case ................................ ................................ .. 1338 • levine_smume7_ism_ols_07.doc The Managing Ashland MultiComm Services Case ................................ ......................... 1340 • levine_smume7_ism_ols_08.doc The Mountain States Potato Company Case ................................ ................................ .... 1394 • levine_smume7_ism_ols_09.doc The Sure Value Convenience Stores Case ................................ ................................ ........ 1402 • levine_smume7_ism_ols_10.doc
Page 4 Read page 4 as text
Preface The first part of the Instructor’s Solutions Manual contains our educational philosophy and teaching tips for each chapter of the text. S olutions to End - of - Section Problems and Chapter Review Problems in each chapter follow. Instructional tips and solutions for the digital cases follow. Answers to the Brynne Packaging Case, the CardioGood Fitness Case, the Choice Is Yours/More Descriptive Choices Follow - up Case , the Clear Mountain State Student Surveys Case , the Craybill Instrumentation Company Case , the Managing Ashland MultiComm Services Case, the Mountain States Potato Company Case and the Sure Value Convenience Stores Case are included last. The purpose of this Instructor’s Solutions Manual is to facilitate grading of assignments or exams by instructors and/or teaching assistants. Screen shots using output from PHStat are integrated throughout. Most of the problems are solved using PHStat. To present the steps involved in solving a problem, some intermediate numerical results are presented accurate to only a reasonable number of significant digits. Hence, instructors are reminded that the final results presented in this manual that are obtained using PHStat can sometimes be different from those obtained with a hand calculator computed using the intermediate values due to rounding.
Page 5 Read page 5 as text
Teaching Tips 1 Teaching Tips for Statistics for Managers using Microsoft ® Excel 7 th Ed. Our Starting Point Over a generation ago, advances in “data processing” led to new business opportunities as first centralized and then desktop computing proliferated. The Information Age was born. Computer science became much more than just an adjunct to a mathematics curri c ulum, and whole new fields of studies, such as computer information systems, emerged. More recently, further advances in information technologies have combined with data analysis techniques to create new opportunities in what is more data science than data processing or computer science. The world of business statistics has grown larger, bumping into other disciplines. And, in a reprise of something that occurred a generation ago, new fields of study, this time with names such as informatics, data analytics, and decision science, have emerged. This time of change makes what is taught in business statistics and how it is taught all the more critical. These new fields of study all share statistics as a foundation for further learning. We are accustomed to thinking about change, as seeking ways to continuously improve the teaching of business statistics have always guided our efforts. We actively participate in Decision Sciences Institute (DSI), American Statistical Association (ASA), and Making Statistics More Effective in Schools and Business (MSMESB) conferences. We use the ASA’s Guidelines for Assessment and Instruction (GAISE) reports and combine them with our experiences teaching business statistics to a diverse student body at several large universities. What to teach and how to teach it are particularly significant questions to ask during a time of change. As an author team, we bring a unique collection of experiences that we believe helps us find the proper perspective in balancing the old and the new. Our lead author, David M. Levine, was the first educator, along with Mark L. Berenson, to create a business statistics textbook that discussed using statistical software and incorporated “computer output” as illustrations — just the first of many teaching and
Page 6 Read page 6 as text
Teaching Tips 2 curricular innov a tions in his many years of teaching business statistics. Our second author, David F. Stephan, developed courses and teaching methods in computer information systems and digital media during the information revolution, creating, and then teaching in, one of the first personal computer classrooms in a large school of business along the way. Early in his career, he introduced spreadsheet applications to a business statistics faculty audience that included David Levine, an introduction that would eventually led to the first edition of this textbook. Our newest co - author, Kathryn A. Szabat, has provided statistical advice to various business and non - business communities. Her background in statistics and o p erations research and her experiences interacting with professionals in practice have guided her, as departmental chair, in developing a new, interdisciplinary academic d e partment, Business Systems and Analytics, in response to the technology - and data - driven changes in business today. All three of us benefit from our many years teaching undergraduate business subjects and the diversity of interests and efforts of our past co - authors, Mark Berenson and Timothy Krehbiel. Two of us (Stephan and Szabat) also benefit from formal training and background in educational methods and instructional design. Educational Philosophy As in prior editions of Statistics for Managers Using Microsoft Excel ® , we are guided by these key learning principles: 1. Help students see the relevance of statistics to their own careers by providing examples drawn from the functional areas in which they may be specializing. Students need a frame of reference when learning statistics, especially when statistics is not their major. That frame of reference for business students should be the functional areas of business, such as accounting, finance, information systems, management, and marketing. Each statistics topic needs to be presented in an applied context related to at least one of these functional areas. The focus in teaching each topic should be on its application in business, the interpretation of results, the evaluation of the assumptions, and the discussion of what should be done if the assumptions are violated.
Page 7 Read page 7 as text
Teaching Tips 3 2. Emphasize interpretation of statistical results over mathematical computation. Introductory business statistics courses should recognize the growing need to interpret statistical results that computerized processes create. This makes the interpretation of results more important than knowing how to execute the tedious hand calculations required to produce them. 3. Give students ample practice in understanding how to apply statistics to business. Both classroom examples and homework exercises should involve actual or realistic data as much as possible. Students should work with data sets, both small and large, and be encouraged to look beyond the statistical analysis of data to the interpretation of results in a managerial context. 4. Familiarize students with how to use statistical software to assist business decision - making. Introductory business statistics courses should recognize that programs with statistical functions are commonly found on a business decision maker’s desktop computer. Integrating statistical software into all aspects of an introductory statistics course allows the course to focus on interpretation of results instead of computations (see point 2). 5. Provide clear instructions to students for using statistical applications. Books should explain clearly how to use programs such as Microsoft Excel ® with the study of statistics, without having those instructions dominate the book or distract from the learning of statistical concepts.
Page 8 Read page 8 as text
Teaching Tips 4 Let’s Get Started: Big Things to Know First In a time of change, you can never know exactly what knowledge and background students bring into an introductory business statistics classroom. Add that to the need to curb the fear factor about learning statistics that so many students begin with, and there’s a lot to cover even before you teach your first statistical concept. We created “Let’s Get Started: Big Things to Know First” to meet this challenge. This unit sets the context for explaining what statistics is (not what students may think!) while ensuring that all students share an understanding of the forces that make learning business statistics critically important today. Especially designed for instructors teaching with course management tools, including those teaching hybrid or online courses, “Let’s Get Started” has been developed to be posted online or otherwise distributed before the first class section begins and is available from the download page for this book that is discussed in Appendix Section C.1. We would argue that the most important class is the first class. First impressions are critically important. You have the opportunity to set the tone to create a new impression that the course will be important to their business education. Make the following points: • T his course is not a math course. • State that you will be learning analytical skills for making business decisions. • Explain that the focus will be on how statistics can be used in the functional areas of business. This book uses a systematic approach for meeting a business objective or solving a business problem. This approach goes across all the topics in the book and most importantly can be used as a framework in real world situations when students graduate. The approach has the acronym DCOVA , which stands for D efine, C ollect, O rganize, V isualize, and A nalyze. • D efine the business objective or problem to be solved and then define the variables to be studied. • C ollect the data from appropriate sources • O rganize the data • V isualize the data by developing charts • A nalyze the data by using statistical methods to reach conclusions.
Page 9 Read page 9 as text
Teaching Tips 5 You can begin by emphasizing the importance of defining your objective or problem. Then, discuss the importance of operational definitions of variables to be considered and define variable, data, and statistics. Just as computers are used not just in the computer course, students need to know that statistics is used not just in the statistics course. This leads you to a discussion of business analytics in which data is used to make decisions. Make the point that analytics should be part of the competitive strategy of every organization especially since “big data” , meaning data collect ed in huge volumes at very fast rates , need s to be analyzed. Inform the students that there is an Excel Guide at the end of each chapter. Strongly encourage or require students to read the Excel Guide at the end of this chapter so that they will be ready to use Excel with this book.
Page 10 Read page 10 as text
Teaching Tips 6 Chapter 1 Y ou need to continue the discuss ion of the Define task by establishing the types of variables. Be sure to discuss the different types carefully since the ability to distinguish between categorical and numerical data will be crucial later in the course . Go over examples of each type of variable and have students provide examples of each type. Then, if you wish, you can cover the different measurement scales. Then move on to the C of the DCOVA approach, collecting data. Mention the different sources of data and make sure to cover the fact that data often need to be cleaned of errors. Then, you could spend some time discussing sampling, even if it is just using the table of random numbers to select a random sample. You may want to take a bit more time and discuss the types of survey sampling methods and issues involved with survey sampling results. The Think About This essay discusses the important issue of the use of Web - based surveys. The chapter also introduces two continuing case s related to the Managing Ashland MultiComm Services and CardioGood Fitness that appears at the end of many chapters. The Digital case s are introduced in this chapter also. In these cases, students visit Web sites related to companies and issues raised in the Using Statistics scenarios that start each chapter. The goal of the Digital case s is for students to develop skills need ed to identify misuses of statistical information. As would be the situation with many real world cases, in Digital case s , students often need to sift through claims and assorted information in order to discover the data most relevant to a case task. They will then have to examine whether the conclusions and claims are supported by the data. (Instructional tips for using the Managing Ashland MultiComm Services and Digital case s and solutions to the Managing Ashland MultiComm Services and Digital case s are included in this Instructor’s Solutions Manual .). M ake sure that students read the Excel Guide at the end of each chapter. S ection EG2 on page 10 explains the different type of Excel instructions. The In - Depth Excel instructions provide step - by - step instructions and live worksheets that automatically update when data changes. These instructions can also be used with OpenOffice.org Calc 3. The PHSta t 2 add - in instructions provide instructions for using the PHStat2 add - in. Analysis ToolPak instructions provide instructions for using the Analysis ToolPak, the Excel add - in package that is included with many versions of Excel.
Page 11 Read page 11 as text
Teaching Tips 7 Chapter 2 This chapter moves on to the organizing and visualizing steps of the DCOVA framework. I f you are going to collect sample data to use in Chapters 2 and 3, you can illustrate sampling by conducting a survey of students in your class. Ask each student to collect his or her own personal data concerning the time it takes to get ready to go to class in the morning or the time it takes to get to school or home from school. First, ask the students to write down a definition of how they plan to measure this time. Then, collect the various answers and read them to the class. Then, a single definition could be provided (such as the time to get ready is the time measured from when you get out of bed to when you leave your home, recorded to the nearest minute). In the next class, select a random sample of students and use the data collected (depending on the sample size) in class when Chapters 2 and 3 are discussed. Then, move on to the Organize step that involves setting up your data in an Excel worksheet and develop tables to help you prepare charts and analyze your data. Begin your discussion for categorical data with the example on p. 41 concerning what bosses demand during vacation time . Show the summary table and then if you wish, explain that you can sometimes organize the data into a two - way table that has one variable in the row and another in the column. Continue with organizing data (but now for numerical data) by referring to the cost of a restaurant meal on p. 46 . Show the simple ordered array and how a frequency distribution, percentage distribution , or cumulative distribution can summarize the raw data in a way that is more useful. Now you are ready to tackle the Visualize step. A good way of starting this part of the chapter is to display the following quote. " A picture is worth a thousand words." Students will almost certainly be familiar with Microsoft ® Word and may have already used Excel to construct charts that they have pasted into Word documents. Now you will be using Excel to construct many different types of charts. Return to the vacation demands data previously discussed and illustrate how a bar chart and pie chart can be constructed. Mention the ir advantages and disadvantages. A good example is to show the data on incomplete ATM transactions on p. 57 and how the Pareto chart enables you to focus on the vital few categories. If time permits, you can discuss the side - by - side bar chart for a contingency table. To examine charts for numerical variables you can either use the restaurant data previously mentioned or data that you have collected from your class. You may want to begin with a simple stem - and - leaf display that both organizes the data and shows a bar type chart. Then move on to the histogram and the various polygons, pointing out the advantages and disadvantages of each.
Page 12 Read page 12 as text
Teaching Tips 8 If the opportunity is available, we believe that it is worth the time to cov er Section 2.6 on Challenges in Visualizing Data . This is a topic that students very much enjoy since it allows for a great deal of classroom interaction. After discussing the fundamental principles of good graph s , try to illustrate some of the improper displays shown in Figures 2. 18 – 2. 20 . Ask students what is “bad” about these figures. Follow up with a homework assignment involving Problems 2. 54 – 2. 57 ( USA Today is a great source). If time permits, you can discuss the scatter plot and the time - series plot for two numerical variables. Otherwise, you can wait until you get to regression analysis. Also , you may want to discuss how multidimensional tables allow you to drill down to individual cells of the table. You can follow this with further discussion of PivotTables and Excel slicers that enable you to see panels for each variable being studied. You will find that the chapter review problems provide large data sets with numerous variables. Report writing exercises provide the opportunity for students to integrate written and or oral presentation with the statistics they have learned. The Managing Ashland MultiComm Services case enables students to examine the use of statistics in an actual business environment. The Digital case refers to the EndRun Financial Service s and claims that have been made. The CardioGood Fitness case focuses on developing a customer profile for a market research team. The Choice Is Yours Follow - up expands on the chapter discussion of the mutual funds data. The Clear Mountain State Student Survey s provides data collected from a sample of undergraduate students and a separate sample of graduate students. The Excel Guide for this and the remaining chapters are organized according to the sections of the chapter. It is quite extensive since it covers both organizing and visualizing many different graphs. The Excel Guide includes instructions for In - Depth Excel, PHStat2, and the Analysis ToolPak , and allows you to choose the approaches that you prefer.
Page 13 Read page 13 as text
Teaching Tips 9 Chapter 3 This chapter on descriptive numerical statistical measures represents the initial presentation of statistical symbols in the text. Students who need to review arithmetic and algebraic concepts may wish to refer to Appendix A for a quick review or to appropriate texts (see www. p earson .com ) or videos ( www.videoaidedinstruction.com ). Once again, as with the tables and charts construct ed for numerical data, it is useful to provide an interesting set of data for classroom discussion. If a sample of students was selected earlier in the semester and data concerning student time to get ready or commuting time was collected (see Chapters 1 and 2), use these data in developing the numerous descriptive summary measures in this chapter. (If they have not been developed, use other data for classroom illustration.) Discussion of the chapter begins with the property of central tendency. We have found that almost all students are familiar with the arithmetic mean (which they know as the average) and most students are familiar with the median. A good way to begin is to compute the mean for your classroom example. Emphasize the effect of extreme values on the arithmetic mean and point out that the mean is like the center of a seesaw -- a balance point. Note that you will return to this concept later when you discuss the variance and the standard deviation. You might want to introduce summation notation at this point and express the arithmetic mean in formula notation as in Equation (3.1). (Alternatively, you could wait until you cover the variance and standard deviation.) A classroom example in which summation notation is reviewed is usually worthwhile. Remind the students again that Appendix A includes a review of arithmetic and algebra and summation notation [or refer them to other text sources such as those found at www. p earson .com or videos (see www. videoaidedinstruction.com )]. The next statistic to compute is the median. Be sure to remind the students that the median as a measure of position must have all the values ranked in order from lowest to highest. Be sure to have the students compare the arithmetic mean to the median and explain that this tells us something about another property of data (skewness). Following the median, the mode can be briefly discussed. Once again, have the students compare this result to those of the arithmetic mean and median for your data set. If time permits, you can also discuss the geometric mean which is heavily used in finance. The completion of the discussion of central tendency leads to the second characteristic of data, variability. Mention that all measures of variation have several things in common: (1) they can never be negative, (2) they will be equal to 0 when all items are the same, (3) they will be small when there isn't much variation, and (4) they will be large when there is a great deal of variation. The first measure of variability to consider is the simplest one, the range. Be sure to point out that the range only provides information about the extremes, not about the distribution between the extremes. P oint out that the range lack s one important ingredient, the ability to take into account each data value. Bring up the idea of computing the differences around the mean, but then return to the fact that as
Page 14 Read page 14 as text
Teaching Tips 10 the balance point of the seesaw, these differences add up to zero. At that point, ask the students what they can do mathematically to remove the negative sign for some of the values. Most likely, they will answer by telling you to square them (although someone may realize that the absolute value could be taken). Next, you may want to define the squared differences as a sum of squares. Now you need to have the students realize that the number of value s being considered affects the magnitude of the sum of squared differences. Therefore, it makes sense to divide by the number of value s and compute a measure called the variance. If a population is involved, you divide by N , the population size, but if you are using a sample, you divide by n - 1, to make the sample result a better estimate of the population variance. You can finish the development of variation by noting that since the variance is in squared units, you need to take the square root to compute the standard deviation. Another measure of variation that can be discussed is the coefficient of variation. Be sure to illustrate the usefulness of this as a measure of relative variation by using an example in which two data sets have vastly different standard deviations, but also vastly different means. A good example is one that involves the volatility of stock prices. Point out that the variation of the price should be considered in the context of the magnitude of the arithmetic mean. At this point you may want to have the students use the Visual Explorations in Statistics Descriptive procedure (see p. 120 ) . By changing values in the data provided, students can observe how the mean, median, and standard deviation are affected. The final measure of variation is the Z score. Point out that this provides a measure of variation in standard deviation units. You can also say that you will return to Z scores in Chapter 6 when the normal distribution will be discussed. You are now ready to move on to the third characteristic of data, shape . Be sure to clearly define and illustrate both symmetric and skewed distributions by comparing the mean and median. You may also want to briefly mention the property of kurtosis which is the relative concentration of values in the center of the distribution as compared to the tails. This statistic is provided by Excel through an Excel function or the Analysis Toolpak . Once these three characteristics have been discussed, you are ready to show how they can be computed using Excel. Now that these measures are understood , you can further explore data by computing the quartiles, the interquartile range, the five number summary, and constructing a boxplot . You begin by determining the quartiles. Reference here can be made to the standardized exams that most students have taken, and the quantile scores that they have received (97th percentile, 48th percentile , 12th percentile , …, etc. ). Explain that the 1 st and 3 rd quartiles are merely two special quantiles -- the 25th and 75th, that unlike the median (the 2 nd quartile) , are not at the center of the distribution. Once the quartiles have been computed, the interquartile range can be de termin ed. Mention that the interquartile range computes the
Page 15 Read page 15 as text
Teaching Tips 11 variation in the center of the distribution as compared to the difference in the extremes computed by the range. You can then discuss the five - number summary of minimum value, first quartile, median, third quartile, and maximum value. Then, you construct the boxplot. Present this plot from the perspective of serving as a tool for determining the location, variability, and symmetry of a distribution by visual inspection, and as a graphical tool for comparing the distribution of several groups. It is useful to display Figure 3. 5 on page 129 that indicates the shape of the boxplot for four different distributions. Then, use PHStat2 to construct a boxplot. Note that you can construct the boxplot for a single group or for multiple groups. If you desire, you can discuss descriptive measures for a population and introduce the empirical rule and the Chebyshev rule. If time permits, and you have covered scatter plot s in Chapter 2, you can briefly discuss the covariance and the coefficient of correlation as a measure of the strength of the association between two numerical variables. Point out that the coefficient of correlation has the advantage as compared to the covariance of being on a scale that goes from - 1 to +1. Figure 3. 8 on p. 139 is useful in depicting scatter plot s for different coefficients of correlation. Once again, you will find that the chapter review problems provide large data sets with numerous variables. The Managing Ashland MultiComm Services case enables students to examine the use of descriptive statistics in an actual business environment. The Digital case continues the evaluation of the EndRun Financial Service s discussed in the Digital case in Chapter 2. The CardioGood Fitness case focuses on developing a customer profile for a market research team. More Descriptive Choices Follow - up expands on the discussion of the mutual funds data. The Clear Mountain State Student Survey s provides data collected from a sample of undergraduate students and a separate sample of graduate students. The Excel Guide for the chapter includes instructions on using different Excel functions to compute various statistics. Alternatively, you can use PHStat or the Analysis ToolPak to compute a list of statistics. PHStat2 can be used to construct a boxplot.
Page 16 Read page 16 as text
Teaching Tips 12 Chapter 4 The chapter on probability represents a bridge between the descriptive statistics already covered and the topics of statistical inference, regression, time series, and quality improvement to be covered in subsequent chapters. In many traditional statistics courses, often a great deal of time is spent on probability topics that are of little direct applicability in basic statistics. The approach in this text is to cover only those topics that are of direct applicability in the remainder of the text. You need to begin with a relatively concise discussion of some probability rules. Essentially, students really just need to know that (1) no probability can be negative, (2) no probability can be more than 1, and (3) the sum of the probabilities of a set of mutually exclusive events adds to 1.0. Students often understand the subject best if it is taught intuitively with a minimum of formulas, with an example that relates to a business application shown as a two - way contingency table (see the Using Statistics example). If desired, you can use In - Depth Excel or PHStat2 to compute probabilities from the contingency table. Once these basic elements of probability have been discussed, if there is time and you desire, conditional probability and Bayes ’ theorem can be covered. The Think About This concerning email SPAM is a wonderful way of helping student s realize the application of probability to everyday life. Be aware that in a one - semester course where time is particularly limited, these topics may be of marginal importance. The Digital case in this chapter extends the evaluation of the EndRun Financial Service s to consider claims made about various probabilities. The CardioGood Fitness , More Descriptive Choices Follow - up , and Clear Mountain State Student Survey s each involve developing contingency tables to be able to compute and interpret conditional and marginal probabilities.
Page 17 Read page 17 as text
Teaching Tips 13 Chapter 5 Now that the basic principles of probability have been discussed, the probability distribution is developed and the expected value and variance (and standard deviation) are computed and interpreted. Once a probability distribution has been defined, you are now ready to discuss the covariance, which is of particular importance to students majoring in finance. It is referred to in various finance courses including those on portfolio management and corporate finance. Use the example in the text to illustrate the covariance. If desired, continue with coverage of portfolio expected return and portfolio risk. Note that the PHStat 2 Covariance and Portfolio Management menu selection allows you to readily compute the pertinent statistics. It also allows you to demonstrate changes in either the probabilities or the returns and their effect on the results. If you are using In - Depth Excel, you can start with the Portfolio.xls workbook and show how various Excel functions can be used to compute the desired statistics. Given that a probability distribution has been defined, you can now discuss some specific distributions. Although every introductory course undoubtedly covers the normal distribution to be discussed in Chapter 6, the decision about whether to cover the binomial, Poisson, or hypergeometric distributions is matter of personal choice and depends on whether the course is part of a two - course sequence. If the binomial distribution is covered, an interesting way of developing the binomial formula is to follow the Using Statistics example that involves an accounting information system. Note, in this example, the value for p is 0.10. (It is best not to use an example with p = 0.50 since this represents a special case). The discussion proceeds by asking how you could get three tagged order forms in a sample of 4. Usually a response will be elicited that provides three items of interest out of four selections in a particular order such as Tagged Tagged Not Tagged Tagged. Ask the class, what would be the probability of gett ing Tagged on the first selection? When someone responds 0.1, ask them how they found that answer and what would be the probability of getting Tagged on the second selection. When they answer 0.1 again, you will be able to make the point that in saying 0.1 again, they are assuming that the probability of Tagged stays constant from trial to trial. When you get to the third selection and the students respond 0.9, point out that this is a second assumption of the binomial distribution -- that only two outcomes are possible -- in this case Tagged and Not Tagged, and the sum of the probabilities of Tagged and Not Tagged must add to 1.0. Now you can compute the probability of three out of four in this order by multiplying (0.1)(0.1)(0.9)(0.1) to get 0. 00 09 . Ask the class if this is the answer to the original question. Point out that this is just one way of getting three Tagged out of four selections in a specific order, and, that there are four ways to get three Tagged out of four selections , or (0.0009)(4) = 0.0036. Th is leads to the development of the binomial formula Equation (5.11). You might want to do another example at this point that calls for adding several probabilities such as three or more Tagged, less
Page 18 Read page 18 as text
Teaching Tips 14 than three Tagged, etc. Complete the discussion of the binomial distribution with the computation of the mean and standard deviation of the distribution. Be sure to point out that for samples greater than five, computations can become unwieldy and the student should use PHStat 2 , an Excel function , or the binomial tables ( See the Online Binomial.pdf tables ). Once the binomial distribution has been covered , if time permits, other discrete probability distributions can be presented. If you cover t he Poisson distribution , poin t out the distinction between the binomial and Poisson distributions. Note that the Poisson is based on an area of opportunity in which you are counting occurrences within an area such as time or space. Contrast this with the binomial distribution in which each value is classified as of interest or not of interest . Point out the equations for the mean and standard deviation of the Poisson distribution and indicate that the mean is equal to the variance. Since the computation of probabilities from these discrete probability distributions can become tedious for other than small sample sizes, it is important to discuss PHStat 2, an Excel function or the Poisson tables ( See the Online Poisson .pdf tables ) . The hypergeometric distribution can be developed for the situation in which one is sampling without replacement. Once again, use PHStat 2 or an Excel function. The Managing Ashland MultiComm Services case for this chapter relates to the binomial distribution. The Digital case involves the expected value and standard deviation of a probability distribution and applications of the covariance in finance.
Page 19 Read page 19 as text
Teaching Tips 15 Chapter 6 Now that probability and probability distributions have been discussed in Chapter s 4 and 5 , you are ready to introduce the normal distribution. We recommend that you begin by mentioning some reasons that the normal distribution is so important and discuss several of its properties. We would also recommend that you do not show Equation (6.1) in class as it will just intimidate some students. You might begin by focusing on the fact that any normal distribution is defined by its mean and standard deviation and display Figure 6. 3 on p. 222 . Then, an example can be introduced and you can explain that if you subtracted the mean from a particular value, and divided by the standard deviation, the difference between the value and the mean would be expressed as a standard ized normal or Z score that was discussed in Chapter 3. Next, use Table E.2, the cumulative normal distribution, to find probabilities under the normal curve. In the text, the cumulative normal distribution is used since this table is consistent with results provided by Excel . Make sure that all the students can find the appropriate area under the normal curve in their cumulative normal distribution tables. If anyone cannot, show them how to find the correct value. Be sure to remind the class that since the total area under the curve adds to 1.0, the word area is synonymous with the word probability. Once this has been accomplished, a good approach is to work through a series of examples with the class, having a different student explain how to find each answer. The example that will undoubtedly cause the most difficulty will be finding the values corresponding to known probabilities. Slowly go over the fact that in this type of example, the probability is known and the Z value needs to be determin ed, which is the opposite of what the student has done in previous examples. Also point out that in cases in which the unknown X value is below the mean, the negative sign must be assigned to the Z value. Once the normal distribution has been covered, you can use PHStat 2 , or various Excel functions to compute normal probabilities. You can also use the Visual Explorations in Statistics Normal D istribution procedure on p p . 230 - 231 . This will be useful if you intend to use examples that explore the effect on the probabilities obtained by changing the X value, the population mean , , or the standard deviation , . The Think About This essay provides a historical perspective of the appl ication of the normal distribution. If you have sufficient time in the course, the normal probability plot can be discussed. Be sure to note that all the data values need to be ranked in order from lowest to highest and that each value needs to be converted to a normal score. Again, you can either use PHStat 2 to generate a normal probability plot or use Excel functions and the Chart Wizard . If time permits, you may want to cover the uniform distribution and refer to the table of random numbers as an example of this distribution. If you plan to cover the exponential distribution, it is useful to discuss applications of this distribution in queu i ng (waiting line) theory. In addition, be sure to point out
Page 20 Read page 20 as text
Teaching Tips 16 that Equation (6. 10 ) provides the probability of an arrival in less than or equal to a given amount of time. Be sure to mention that you can use PHStat 2 or an Excel function to compute exponential probabilities. The Managing Ashland MultiComm Services case for this chapter relates to the normal distribution. The Digital case involves the normal distribution and the normal probability plot. The CardioGood Fitness , More Descriptive Choices Follow - up , and Clear Mountain State Student Survey s each involve developing normal probability plot s. You can use either Excel functions or the PHStat add - in to compute normal and exponential probabilities and to construct normal probability plots.
Page 21 Read page 21 as text
Teaching Tips 17 Chapter 7 The coverage of the normal distribution in Chapter 6 flows into a discussion of sampling distributions. Point out the fact that the concept of the sampling distribution of a statistic is important for statistical inference. Make sure that students realize that problems in this section will find probabilities concerning the mean , not concerning individual values. It is helpful to display Figure 7. 4 on p. 257 to show how the Central Limit Theorem applies to different shaped populations. A useful classroom or homework exercise involves using PHStat 2 or Excel to form sampling distributions. This reinforces the concept of the Central Limit Theorem. The Managing Ashland MultiComm Services case for this chapter relates to the sampling distribution of the mean. The Digital case also involves the sampling distribution of the mean. You might want to have students experiment with using the Visual Explorations add - in workbook to explore sampling distributions. You can also use either Excel functions, the PHStat add - in, or the Analysis ToolPak to develop sampling distribution simulations.
Page 22 Read page 22 as text
Teaching Tips 18 Chapter 8 You should begin this chapter by reviewing the concept of the sampling distribution covered in Chapter 7 . It is important that the students realize that (1) an interval estimate provides a range of values for the estimate of the population parameter, (2) you can never be sure that the interval developed does include the population parameter, and (3) the proportion of intervals that include the population parameter within the interval is equal to the confidence level. Note that the Using Statistics example for this chapter, which refers to the Ricknel Home Centers is actually a case study that relates to every part of the chapter. This scenario is a good candidate for use as the classroom example demonstrating an application of statistics in accounting. It also enables you to use the DCOVA approach of Define, Collect, Organize , Visualize, and Analyze in the context of statistical inference. When introducing the t distribution for the confidence interval estimate of the population mean, be sure to point out the differences between the t and normal distributions, the assumption of normality, and the robustness of the procedure. It is useful to display Table E.3 in class to illustrate how to find the critical t value. When developing the confidence interval for the proportion, remind the students that the normal distribution may be used here as an approximation to the binomial distribution as long as the assumption of normality is valid [when n and n (1 - ) are at least 5]. Having covered confidence intervals, you can move on to sample size determination by turning the initial question of estimation around, and focusing on the sample size needed for a desired confidence level and width of the interval. In discussing sample size determination for the mean, be sure to focus on the need for an estimate of the standard deviation. When discussing sample size determination for the proportion, be sure to focus on the need for an estimate of the population proportion and the fact that a value of = 0.5 can be used in the absence of any other estimate. If time permits, you may wish to discuss the effect of the finite population (this i s an Online Topic that can be downloaded from the text web site ) on the width of the confidence interval and the s ample size needed. Point out that the correction factor should always be used when dealing with a finite population, but will have only a small effect when the sample size is a small proportion of the population size. Due to the existence of a large number of accounting majors in many business schools, we have included a n online section on applications of estimation in auditing. Two applications are included, the estimation of the total, and difference estimation. In estimating the total, point out that estimating the total is similar to estimating the mean, except that you are multiplying both the mean and the width of the confidence interval by the population size. When discussing difference estimation, be sure that the students realize that all differences of zero must be accounted for in computing the mean difference and the standard deviation of the difference when using Equations (8.8) and (8.9) .
Page 23 Read page 23 as text
Teaching Tips 19 Since the formulas for the confidence interval estimates and sample sizes discussed in this chapter are straightforward, using PHStat 2 or In - Depth Excel can remove much of the tedious nature of these computations. The Managing Ashland MultiComm Services case for this chapter involves develop ing various confidence intervals and interpreting the results in a marketing context. The Digital case also relates to confidence interval estimation. This chapter marks the first appearance of the Sure Value Convenience Store s case which places the student in the role of someone working in the corporate office of a nationwide convenience store franchise. This case will appear in the next three chapters, Chapters 9 – 11, and also in Chapter 15. The CardioGood Fitness , More Descriptive Choices Follow - up , and Clear Mountain State Student Survey s each involve developing confidence interval estimates. You can use either Excel functions or the PHStat add - in to construct confidence intervals for means and proportions and to determine the sample size for means and proportions.
Page 24 Read page 24 as text
Teaching Tips 20 Chapter 9 A good way to begin the chapter is to focus on the reasons that hypothesis testing is used. We believe that it is important for students to understand the logic of hypothesis testing before they delve into the details of computing test statistics and making decisions. If you begin with the Using Statistics example concerning the filling of cereal boxes, slowly develop the rationale for the null and alternative hypotheses. Ask the students what conclusion they would reach if a sample revealed a mean of 200 grams (They will all say that something is the matter) and if a sample revealed a mean of 367.99 grams (Almost all will say that the difference between the sample result and what the mean is supposed to be is so small that it must be due to chance). Be sure to make the point that hypothesis testing allows you to take away the decision from a person's subjective judgment, and enables you to make a decision while at the same time quantifying the risks of different types of incorrect decisions. Be sure to go over the meaning of the Type I and Type II e rrors, and their associated probabilities and along with the concept of statistical power (more extensive coverage of the power of a test is included in Section 9 . 6 which is an Online Topic that can be downloaded from the text web site ). Set up an exa mple of a sampling distribution such as Figure 9 .1 on p. 308 , and show the regions of rejection and nonrejection. Explain that the sampling distribution and the test statistic involved will change depending on the characteristic being tested. Focus on the situation where is unknown if you have numerical data. Emphasize that is virtually never known. It is also useful at this point to introduce the concept of the p - value approach as an alternative to the classical hypothesis testing approach. Define the p - value and use the phrase given in the text “If the p - value is low, H o must go.” and the rules for rejecting the null hypothesis and indicate that the p - value approach is a natural approach when using Excel, since the p - value can be determin ed by using PHStat , Excel functions, or the Analysis Toolpak . Once the initial example of hypothesis testing has been developed, you need to focus on the differences between the tests used in various situations. The Chapter 9 summary table of topics is usefu l for this since it presen ts a road map for determining which test is used in which circumstance. Be s ure to point out that one - tail tests are used when the alternative hypothesis involved is directional (e. g. , > 368, < 0 .20). Examine the effect on the results of changing the hypothesized mean or proportion. T he Managing Ashland MultiComm Services case , Digital case , and the Sure Value Convenience Store s case each involve s the use of the one - sample test of hypothesis for the mean. You can use either Excel functions or the PHStat add - in to carry out the hypothesis tests for means and proportions.
Page 25 Read page 25 as text
Teaching Tips 21 Chapter 10 This chapter discusses tests of hypothesis for the differences between two groups. The chapter begins with t tests for the difference between the means, then covers the Z test for the difference between two proportions, and concludes with the F test for the ratio of two variances. The first test of hypothesis covered is usually the test for the difference between the means of two groups for independent samples. Point out that the test statistic involves pooling of the sample variances from the two groups and assumes that the population variances are the same for the two groups. Students should be familiar with the t distribution, assuming that the confidence interval estimate for the mean has been previously covered, Point out that a stem - and - leaf display, a boxplot, or a normal probability plot can be used to evaluate the validity of the assumptions of the t test for a given set of data. This allows you to once again use the DCOVA approach of Define, Collect, Organize , Visualize, and Analyze to meet a business objective. Once the t test has been discussed, you can use the Excel worksheets provided with the In - Depth Excel approach, PHStat 2 , or the Analysis Toolpak to determine the test statistic and p - value. Mention that if the variances are not equal, a separate variance t test can be conducted . The Think About This essay is a wonderful example of how the two - sample t test was used to solve a business problem that a student , who had taken the introductory statistics course, had after she graduated . At this point, having covered the test for the difference between the means of two independent groups, if you have time in your course, you can discuss a test that examine s differences in the means of two paired or matched groups. The key difference is that the focus in this test is on differences between the value s in the two groups since the data have been collected from matched pairs or repeated measurements on the same individuals or items. Once the paired t test has been discussed, the In - Depth Excel approach, PHStat 2 , or the Data Analysis tool can be used to determine the test statistic and p - value. You can continue the coverage of differences between two groups by testing for the difference between two proportions. Be sure to review the difference between numerical and categorical data emphasizing the categorical variable used here classifies each observation as of interest or not of interest . Make sure that the students realize that the test for the difference between two proportions follows the normal distribution. A good classroom example involves asking the students if they enjoy shopping for clothing and then classifying the yes and no responses by gender. Since there will often be a difference between males and females, you can then ask the class how we might go about determining whether the results are statistically significant. The F - test for the variances can be covered next. Be sure to carefully explain that this distribution, unlike the normal and t distributions, is not symmetric and cannot have a negative value
Page 26 Read page 26 as text
Teaching Tips 22 since the statistic is the ratio of two variances. Remind the students that the larger variance is in the numerator . Be sure to mention that a boxplot of the two groups and normal probability plots can be used to determine the validity of the assumptions of the F test. This is particularly important here since this test is sensitive to non - normality in the two populations. T he In - Depth Excel approach, PHStat 2 , or the Analysis Toolpak can be used to determine the test statistic and p - value. Be aware that t he Managing Ashland MultiComm Services case , since it contains both independent sample and match ed sample aspects , involves all the sections of the chapter except the test for the difference between two proportions. The Digital case is based on two independent samples. Thus, only the sections on the t test for independent samples and the F test for the difference between two variances are involved. The Sure Value Convenience Store s case now involves a decision between two prices for coffee. The CardioGood Fitness , More Descriptive Choices Follow - up , and Clear Mountain State Student Survey s each involve the determination of differences between two groups on both numerical and categorical variables. You can use either Excel functions, the PHStat add - in, or the Analysis ToolPak to carry out the hypothesis tests for the differences between means and variances and for the paired t test. You can also use Excel functions or the PHStat add - in to carry out the hypothesis test for the differences between two proportions.
Page 27 Read page 27 as text
Teaching Tips 23 Chapter 1 1 If the one - way ANOVA F test for the difference between c means is to be covered in your course, a good way to start is to go back to the sum of squares concept that was originally covered when the variance and standard deviation were introduced in Section 3.2. Explain that in the one - way Analysis of Variance, the sum of squared differences around the overall mean can be divided into two other sums of squares that add up to the total sum of squares. One of these measures differences among the means of the groups and thus is called sum of squares among groups ( SSA ), while the other measures the differences within the groups and is called the sum of squares within the groups ( SSW ). Be sure to remind the students that, since the variance is a sum of squares divided by degrees of freedom, a variance among the groups and a variance within the groups can be compute d by dividing each sum of squares by the corresponding degrees of freedom. Make the point that the terminology used in the Analysis of Variance for variance is Mean Square, so the variances computed are called MSA , MSW , and MST . This will lead to the development of the F statistic as the ratio of two variances. A useful approach at this point when all formulas are defined, is to set up the ANOVA summary table. Try to minimize the focus on the computations by reminding students that the Analysis of Variance computations can be done using In - Depth Excel, PHStat2, or the Analysis T ool pak . It is also useful to show how to obtain the critical F value by either referring to Table E.5 or the Excel results . Be sure to mention the assumptions of the Analysis of Variance and that the box plot and normal probability plot can be used to evaluate the validity of these assumptions for a given set of data. Levene’s test can be used to test for the equality of variances. In - Depth Excel or PHStat 2 can be used to compute the results for this test. Once the Analysis of Variance has been covered, if time permits (which it may not in a one - semester course), you will want to determine which means are different. Although many approaches are available, this text uses the Tukey - Kramer procedure that involves the Studentized ra nge statistic shown in Table E.7 . Be sure that students compare each paired difference between the means to the critical range. Note that you can use In - Depth Excel or PHStat 2 to compute Tukey - Kramer multiple comparisons. The factorial design model provides coverage of the two - way analysis of variance with equal number of observations for each combination of factor A and factor B . The approach taken in the text is primarily conceptual since, due to the complexity of the computations, the Analysis T ool Pak , or PHStat2 should be used to perform the computations. You should develop the concept of partitioning the total sum of squares ( SST ) into factor A variation ( SSA ), factor B variation ( SSB ), interaction ( SSAB ) and random variation ( SSE ). Then move on to the development of the ANOVA table displayed in Table 11. 6 on p. 408 . Perhaps the most difficult concept to teach in the factorial design model is that of interaction. We believe that the display of an interaction graph such as the one shown in Figure 11. 13 on p. 411 is helpful. In addition, showing an example such as Example 11.2 on page 412 is particularly important, so
Page 28 Read page 28 as text
Teaching Tips 24 that students observe the lack of parallel lines when significant interaction is present. Be sure to emphasize that the interaction effect is always tested prior to the main effects of A and B , since the interpretation of effects A and B will be affected by whether the interaction is significant. The randomized block model which is an online topic is an extension of the paired t test in Chapter 10. Slowly go over the partitioning of the total sum of squares ( SST ) into Among Group variation ( SSA ), Among Block variation ( SSBL ), and Random variation ( SSE ). Discuss the ANOVA table and be sure students realize that Excel can be used to perform the computations. Finish this topic with a brief discussion of the relative efficiency of using the randomized block model and the use of the Tukey procedure for multiple comparisons. The online Section 11.4 briefly discusses the difference between the F tests involved when there are fixed and random effects. The Managing Ashland MultiComm Services case for this chapter involves the one way ANOVA and the two - factor factorial design. The Digital case uses the o ne - w ay ANOVA. The Sure Value Convenience Store s case now involves a decision among four prices for coffee. The CardioGood Fitness , More Descriptive Choices Follow - up , and Clear Mountain State Student Survey s each involves usin g the one - way ANOVA to determine whether differences in numerical variables exist among three or more groups In this chapter, using In - Depth Excel is more complicated than in other chapters, so you may want to focus on using the Analysis ToolPak or PHStat2.
Page 29 Read page 29 as text
Teaching Tips 25 Chapter 1 2 This chapter covers chi - square tests and nonparametric tests. The Using Statistics example concerning hotels relates to the first three sections of the chapter. If you covered the Z test for the difference between two proportions in Chapter 10 , you can return to the example you used there and point out that the chi - square test can be used as an alternative. A good classroom example involves asking the students if they enjoy shopping for clothing (or revisiting Chapter 10’s example) and then classifying the yes and no responses by gender. Since there will often be a difference between males and females, you can then ask the class how the y might go about determining whether the results are statistically significant. The expected frequencies are comput ed by finding the mean proportion of items of interest (enjoying shopping) and items not of interest (not enjoying shopping) and multiplying by the sample sizes of males and females respectively. This leads to the computation of the test statistic. Once again as with the case of the normal, t , and F distribution, be sure to set up a picture of the chi - square distribution with its regions of rejection and non - rejection and critical values. In addition, go over the assumptions of the chi square test including the requirement for an expected frequency of at least five in each cell of the 2 × 2 contingency table. Now you are ready to extend the chi - square test to more than two groups. Be sure to discuss the fact that with more than two groups, the number of degrees of freedom will change and the requirements for minimum cell expected frequencies will be somewhat less restrictive. If you have time, you can develop the Marascuilo procedure to determine which groups differ. The discussion of the chi - square test concludes with the test of independence in the r by c table. Be sure to go over the interpretation of the null and alternative hypotheses and how they differ from the situation in which there are only two rows. If you will be covering the Wilcoxon rank sum test, begi n by noting that if the normality assumption was seriously violated, this test would be a good alternative to the t test for the difference between the means of two independent samples. Be sure to discuss the need to rank all the data values without regard to group. Review the fact that the statistic T 1 refers to the sum of the ranks for the group with the smaller sample size. If small samples are involved, be sure to point out that the null hypothesis is rejected if the test statistic T 1 is less than or equal to the lower critical value or greater than or equal to the upper critical value. In addition, explain when the normal approximation can be used. Point out that In - Depth Excel or PHStat 2 can be used for the Wilcoxon rank sum test. If the Kruskal - Wallis rank test is to be covered, you can explain that if the assumption of normality has been seriously violated, the Kruskal - Wallis rank test may be a better test procedure than the one - way ANOVA. Once again, be sure to discuss the need to rank all the data values without regard to
Page 30 Read page 30 as text
Teaching Tips 26 group. Go over how to find the critical values of the c hi - square statistic using Table E.4. As was the case with the Wilcoxon rank sum test, In - Depth Exce l or PHStat 2 an be used for the Kruskal - Wallis rank test. If you wish, you can briefly discuss the McNemar test which is an online topic . Explain that just like you use d the paired - t test when you had related samples of numerical data, you use the McNemar test instead of the chi - square test when you have related samples of categorical data. Make sure to state that for two samples of related categorical data, the McNemar test is more powerful than the chi - square test. You can then move on, if you wish, to the one sample test for the variance which is an online topic . Remind the students that if they are doing a two - tail test, they also need to find the lower critical value in the lower tail of the chi - square distribution. The Managing Ashland MultiComm Services case extends the survey discussed in C hapter 8 to analyze data from contingency tables. The Digital case also involves analyzing various contingency tables. The Sure Value Convenience Store s case and the CardioGood Fitness cases involve using the Kruskal - Wallis test instead of the one - way ANOVA, The More Descr i ptive Choices Follow - up and Clear Mountain State Student Survey s cases involve both contingency tables and nonparametric tests. You can use In - Depth Excel or PHStat 2 for testing differences between the proportions, tests of independence, and also for the Wilcoxon rank sum test and the Kruskal - Wallis test..
Page 31 Read page 31 as text
Teaching Tips 27 Chapter 1 3 Regression analysis is probably the most widely used and misused statistical method in business and economics. You may want to start the chapter with the Think About This essay on p. 510 to show students the importance of this topic in business. In an era of easily available statistical and spreadsheet applications , we believe that the best approach is one that focuses on the interpretation of regression results obtained from such applications , the assumptions of regression, how those assumptions can be evaluated, and what can be done if they are violated. Although we also feel that is useful for students to work out at least one example with the aid of a hand calculator, we believe that the focus on hand calculations should be minimized. A good way to begin the discussion of regression analysis is to focus on develop ing a model that can provid e a better prediction of a variable of interest. The Using Statistics example, which forecasts sales for a clothing store, is useful for this purpose. You can extend the DCOVA approach discussed earlier by defining the business objective, discussing data collection, and data organization before moving on to the visualization and analysis in this chapter. Be sure to clearly define the dependent variable and the independent variable at this point. Once the two types of variables have been defined, the example should be introduced. Explain the goal of the analysis and how regression can be useful. Follow this with a scatter plot of the two variables. Before developing the Least Squares method, review the straight - line formula and note that different notation is used in statistics for the intercept and the slope than in mathematics. At this point , you need to develop the concept of how the straight line that best fits the data can be found. One approach involves plotting several lines on a scatter plot and asking the students how they can determine which line fits the data better than any other. This usually leads to a criterion that minimizes the differences between the actual Y value and the value that would be predicted by the regression line. Remind the class that when you computed the mean in Chapter 3, you found out that the sum of the differences around the mean was equal to zero. Tell the class that the regression line in two dimensions is similar to the mean in one dimension, and that the differences between the actual Y value and the value that would be predicted by the regression line will sum to zero. Students at this point, having covered the variance, will usually tell you just to square the differences. At this juncture, you might want to substitute the regression equation for the predicted value, and tell the students that since you are minimizing a quantity, derivatives are used. We discourage you from doing the actual proof, but mention ing derivatives may help some students realize that the calculus they may have learned in mathematics courses is actually used to develop the theory behind the statistical method. The least - squares concepts discussed can be reinforced by using the Visual Explorations in Statistics Simple Linear Regression Coefficients procedure on p. 480 . This procedure produces a scatter plot with an unfitted line of regression and a floating control panel of
1387 more pages in the full document
Unlock it once and it stays in your library, ready to chat with or turn into flashcards.
Unlock the full documentMore Statistics study materials
See all Textbook Guides
Statistics for Managers Using Microsoft Excel 8th Edition Solution Manual
Statistics
1343 pages156downloadsFeb 2025 Exam Guides
Test Bank for Statistics for Managers Using Microsoft Excel, 9th Edition
Statistics
949 pagesMay 2025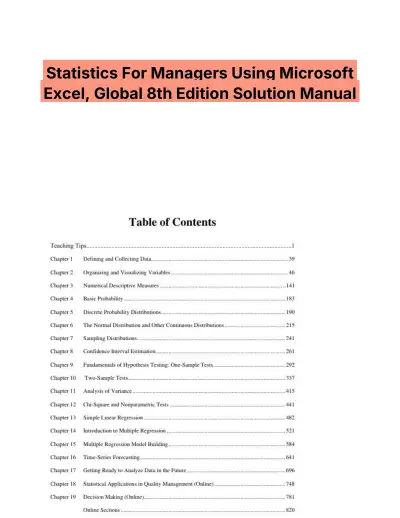 Textbook Guides
Statistics For Managers Using Microsoft Excel, Global 8th Edition Solution Manual
Statistics
1341 pagesMay 2025 Textbook Guides
Solution Manual for Statistics for Managers Using Microsoft Excel, 9th Edition
Statistics
1489 pagesMay 2025 Textbook Guides
Solution Manual for Statistics for Managers Using Microsoft Excel, 9th Edition
Statistics
1488 pagesMay 2025 Exam Guides
Test Bank for Biostatistics for the Biological and Health Sciences , 2nd Edition
Statistics
182 pages161downloadsFeb 2025 Exam Guides
Elementary Statistics, 13th Edition Test Bank
Statistics
239 pages160downloadsFeb 2025 Textbook Guides
Essentials of Social Statistics for a Diverse Society Second Edition Solution Manual
Statistics
137 pages135downloadsFeb 2025
Study this document with CramX
Once it is in your library, every tool can work from it.