Statistics For Managers Using Microsoft Excel, Global 8th Edition Solution Manual

Statistics For Managers Using Microsoft Excel, Global 8th Edition Solution Manual delivers clear and concise summaries of essential textbook content.

Benjamin Fisher
Contributor
4.9
54
10 months ago
Preview (16 of 1341 Pages)
100%
Log in to unlock

Page 1

Statistics For Managers Using Microsoft Excel, Global 8th Edition Solution Manual - Page 1 preview image

Loading page ...

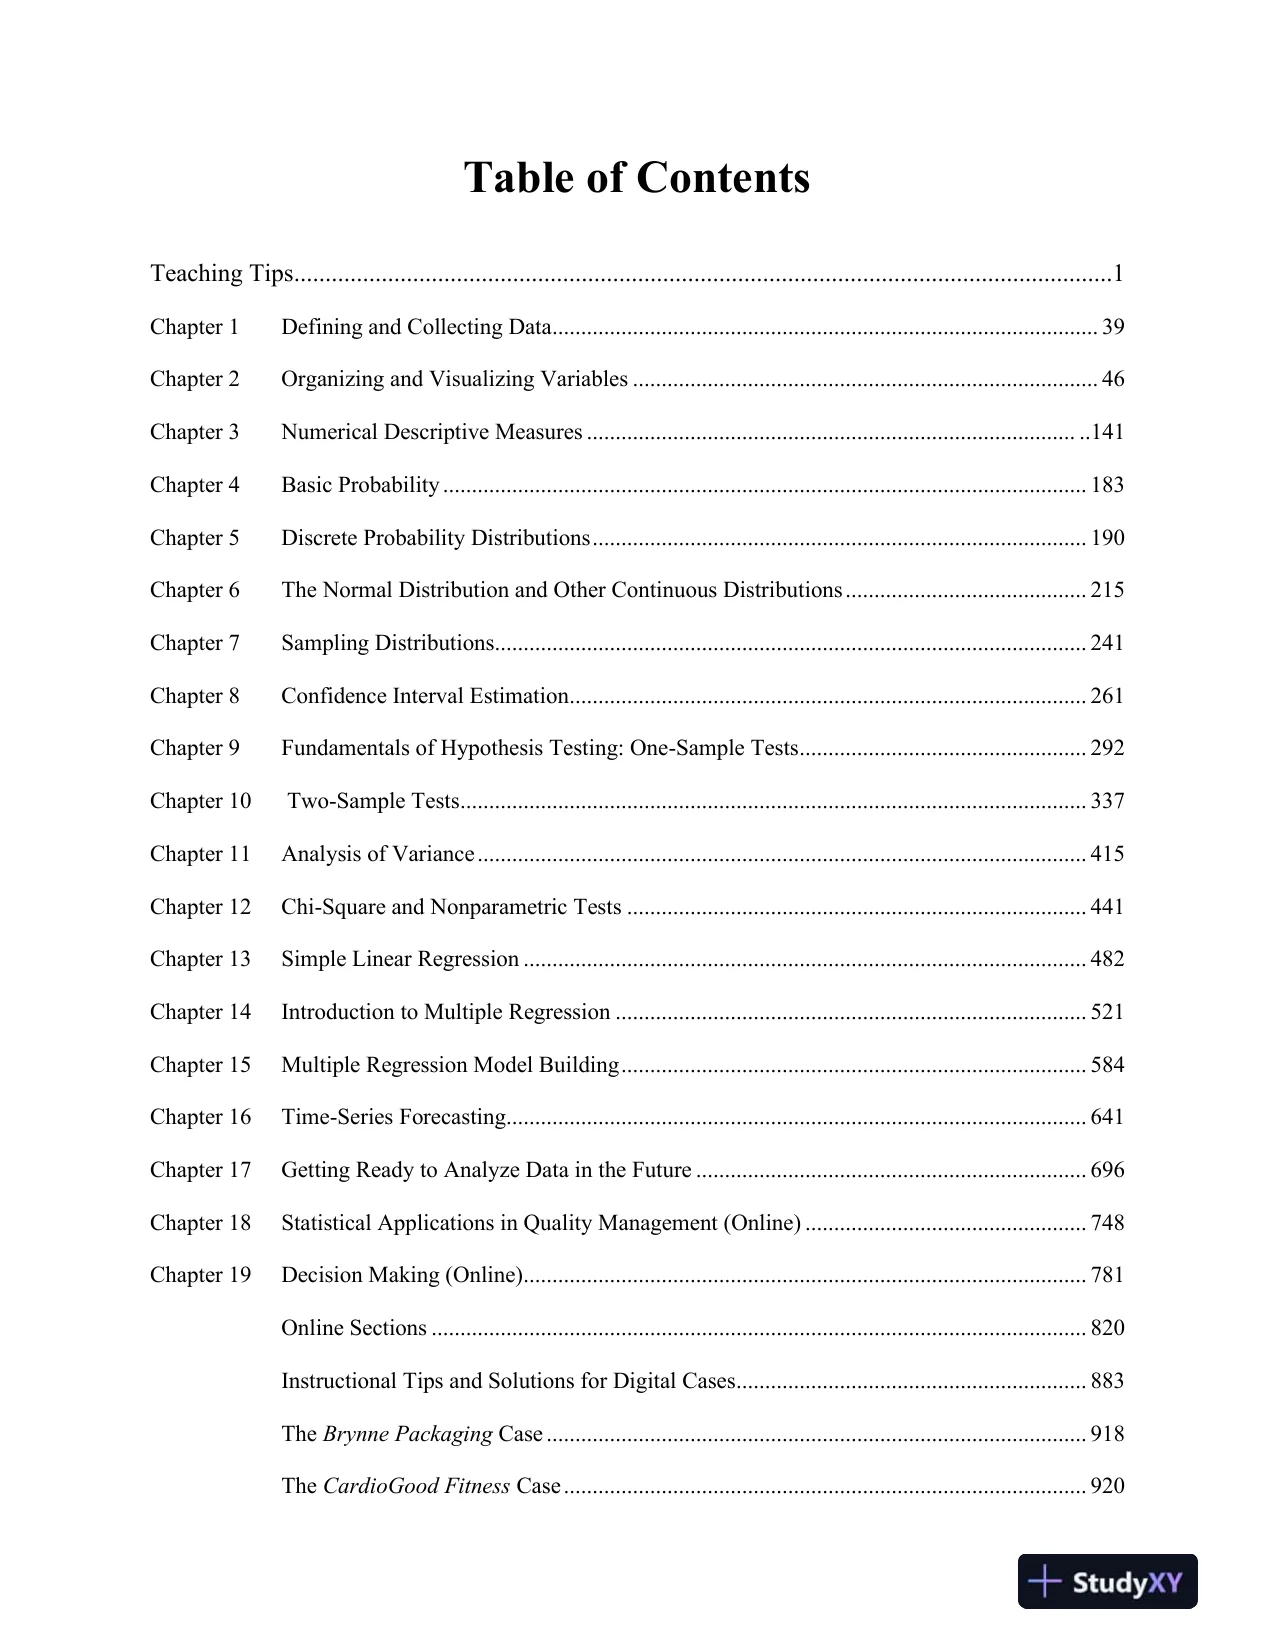
Table of ContentsTeaching Tips...................................................................................................................................1Chapter 1Defining and Collecting Data...............................................................................................39Chapter 2Organizing and VisualizingVariables.................................................................................46Chapter 3Numerical Descriptive Measures.......................................................................................141Chapter 4Basic Probability................................................................................................................183Chapter 5Discrete Probability Distributions......................................................................................190Chapter 6The Normal Distribution and Other Continuous Distributions..........................................215Chapter 7Sampling Distributions.......................................................................................................241Chapter 8Confidence Interval Estimation..........................................................................................261Chapter 9Fundamentals of Hypothesis Testing: One-Sample Tests..................................................292Chapter 10Two-Sample Tests.............................................................................................................337Chapter 11Analysis of Variance..........................................................................................................415Chapter 12Chi-Square and Nonparametric Tests................................................................................441Chapter 13Simple Linear Regression..................................................................................................482Chapter 14Introduction to Multiple Regression..................................................................................521Chapter 15Multiple Regression Model Building.................................................................................584Chapter 16Time-Series Forecasting.....................................................................................................641Chapter 17Getting Ready to Analyze Data in the Future....................................................................696Chapter 18Statistical Applications in Quality Management (Online).................................................748Chapter 19Decision Making (Online)..................................................................................................781Online Sections..................................................................................................................820Instructional Tips and Solutions for Digital Cases.............................................................883TheBrynne PackagingCase..............................................................................................918TheCardioGood FitnessCase...........................................................................................920

Page 2

Statistics For Managers Using Microsoft Excel, Global 8th Edition Solution Manual - Page 2 preview image

Loading page ...

Page 3

Statistics For Managers Using Microsoft Excel, Global 8th Edition Solution Manual - Page 3 preview image

Loading page ...

TheChoice Is Yours/More Descriptive Choices Follow-upCase....................................1043TheClear Mountain State Student SurveysCase.............................................................1130TheCraybill Instrumentation CompanyCase..................................................................1230TheManaging Ashland MultiComm ServicesCase.........................................................1232TheMountain States Potato CompanyCase....................................................................1287TheSure Value Convenience StoresCase........................................................................1296

Page 4

Statistics For Managers Using Microsoft Excel, Global 8th Edition Solution Manual - Page 4 preview image

Loading page ...

PrefaceThe first part of theInstructor’s Solutions Manualcontains our educational philosophy and teaching tipsfor each chapter of the text. Solutions to End-of-Section Problems and Chapter Review Problems in eachchapter follow.Instructional tips and solutions for the digital casesare included next.Answers to theBrynne PackagingCase, theCardioGood FitnessCase, theChoice Is Yours/More Descriptive ChoicesFollow-up Case, theClear Mountain State StudentSurveys Case,theCraybill Instrumentation CompanyCase, theManaging Ashland MultiComm ServicesCase, theMountain States Potato Company CaseandtheSure Value Convenience StoresCase are included last.The purpose of thisInstructor’s Solutions Manualis to facilitate grading of assignments or exams byinstructors and/or teaching assistants. Screen shots using output from PHStat are integrated throughout.Most of the problems are solved using PHStat. To present the steps involved in solving a problem, someintermediate numerical results are presented accurate to only a reasonable number of significant digits.Hence, instructors are reminded that the final results presented in this manual that are obtained usingPHStat can sometimes be different from those obtained with a hand calculator computed using theintermediate values due to rounding.

Page 5

Statistics For Managers Using Microsoft Excel, Global 8th Edition Solution Manual - Page 5 preview image

Loading page ...

Teaching Tips forStatistics for Managers using Microsoft®Excel8thEdition,GlobalEditionOur Starting PointOver a generation ago, advances in “data processing” led to new business opportunities as firstcentralized and then desktop computing proliferated. The Information Age was born. Computerscience became much more than just an adjunct to a mathematics curriculum, and whole newfields of studies, such as computer information systems, emerged.More recently, further advances in information technologies have combined with dataanalysis techniques to create new opportunities in what is more datasciencethan dataprocessingorcomputerscience. The world of business statistics has grown larger, bumping into otherdisciplines. And, in a reprise of something that occurred a generation ago, new fields of study,this time with names such as informatics, data analytics, and decision science, have emerged.This time of change makes what is taught in business statistics and how it is taught all themore critical. These new fields of study all share statistics as a foundation for further learning.We are accustomed to thinking about change, as seeking ways to continuously improve theteaching of business statistics have always guided our efforts. We actively participate in DecisionSciences Institute (DSI), American Statistical Association (ASA), and Making Statistics MoreEffective in Schools and Business (MSMESB) conferences. We use the ASA’s Guidelines forAssessment and Instruction (GAISE) reports and combine them with our experiences teachingbusiness statistics to a diverse student body at several large universities.What to teach and how to teach it are particularly significant questions to ask during a time ofchange. As an author team, we bring a unique collection of experiences that we believe helps usfind the proper perspective in balancing the old and the new. Our lead author, David M. Levine,was the first educator, along with Mark L. Berenson, to create a business statistics textbook that

Page 6

Statistics For Managers Using Microsoft Excel, Global 8th Edition Solution Manual - Page 6 preview image

Loading page ...

discussed using statistical software and incorporated “computer output” as illustrationsjust thefirst of many teaching and curricular innovations in his many years of teaching business statistics.Our second author, David F. Stephan, developed courses and teaching methods in computerinformation systems and digital media during the information revolution, creating, and thenteaching in, one of the first personal computerclassroomsin a large school of business along theway. Early in his career, he introduced spreadsheet applications to a business statistics facultyaudience that included David Levine, an introduction that would eventually led to the first editionof this textbook. Our newest co-author, Kathryn A. Szabat, has provided statistical advice tovarious business and non-business communities. Her background in statistics and operationsresearch and her experiences interacting with professionals in practice have guided her, asdepartmental chair, in developing a new, interdisciplinary academic department, BusinessSystems and Analytics, in response to the technology-and data-driven changes in business today.All three of us benefit from our many years teaching undergraduate business subjects and thediversity of interests and efforts of our past co-authors, Mark Berenson and Timothy Krehbiel.Two of us (Stephan and Szabat) also benefit from formal training and background in educationalmethods and instructional design.Educational PhilosophyAs in prior editions ofStatistics for Managers Using Microsoft Excel, we are guided by thesekey learning principles:1.Help students see the relevance of statistics to their own careers by providing examplesdrawn from the functional areas in which they may be specializing.Students need aframe of reference when learning statistics, especially when statistics is not their major. Thatframe of reference for business students should be the functional areas of business, such asaccounting, finance, information systems, management, and marketing. Each statistics topic

Page 7

Statistics For Managers Using Microsoft Excel, Global 8th Edition Solution Manual - Page 7 preview image

Loading page ...

needs to be presented in an applied context related to at least one of these functional areas.The focus in teaching each topic should be on its application in business, the interpretation ofresults, the evaluation of the assumptions, and the discussion of what should be done if theassumptions are violated.2.Emphasize interpretation of statistical results over mathematical computation.Introductory business statistics courses should recognize the growing need tointerpretstatistical results that computerized processes create. This makes the interpretation of resultsmore important than knowing how to execute the tedious hand calculations required toproduce them.3.Give students ample practice in understanding how to apply statistics to business.Bothclassroom examples and homework exercises should involve actual or realistic data as muchas possible. Students should work with data sets, both small and large, and be encouraged tolook beyond the statistical analysis of data to the interpretation of results in a managerialcontext.4.Familiarize students with how to use statistical software to assist business decision-making.Introductory business statistics courses should recognize that programs withstatistical functions are commonly found on a business decision maker’s desktop computer.Integrating statistical softwareinto all aspects of an introductory statistics course allows thecourse to focus on interpretation of results instead of computations (see point 2).5.Provide clear instructions to students for using statistical applications.Books shouldexplain clearly how to use programs such as Microsoft Excel with the study of statistics,without having those instructions dominate the book or distract from the learning of statisticalconcepts.

Page 8

Statistics For Managers Using Microsoft Excel, Global 8th Edition Solution Manual - Page 8 preview image

Loading page ...

FirstThings FirstIn a time of change, you can never know exactly what knowledge and background students bringinto an introductory business statistics classroom. Add that to the need to curb the fear factorabout learning statistics that so many students begin with, and there’s a lot to cover even beforeyou teach your first statistical concept.We created“FirstThings First” to meet this challenge. This unit sets the context forexplaining what statistics is (not what students may think!) while ensuring that all students sharean understanding of the forces that make learning business statistics critically important today.Especially designed for instructors teaching with course management tools, including thoseteaching hybrid or online courses,“FirstThings First”has been developed to be posted online orotherwise distributed before the first class section begins and is available from the download pagefor this book that is discussed in Appendix Section C.1.We would argue that the most important class is the first class. First impressions are criticallyimportant. You have the opportunity toset the tone to create a new impression that the course willbe important to their business education.Make the following points:This course is not a math course.State that you will be learning analytical skills for making business decisions.Explain that the focus will be on how statistics can be used in the functional areas ofbusiness.This book uses a systematic approach for meeting a business objective or solving a businessproblem. This approach goes across all the topics in the book and most importantly can be used asa framework in real world situations when students graduate. The approach has the acronymDCOVA, which stands forDefine,Collect,Organize,Visualize, andAnalyze.Define the business objective or problem to be solved and then define the variables to bestudied.Collect the data from appropriate sourcesOrganize the data

Page 9

Statistics For Managers Using Microsoft Excel, Global 8th Edition Solution Manual - Page 9 preview image

Loading page ...

Visualize the data by developing chartsAnalyze the data by using statistical methods to reach conclusions.To this, you can addCfor Communicate which is critically importantYou can begin by emphasizing the importance of defining your objective or problem. Then,discuss the importance of operational definitions of variables to be considered and definevariable, data, and statistics.Just as computers are used not just in the computer course, students need to know thatstatistics is used not just in the statistics course.This leads you to a discussion of businessanalytics in which data is used to make decisions. Make the point thatanalyticsshould be part ofthe competitive strategy of every organizationespecially since “big data” meaning data collectedin huge volumes at very fastrates.needsto be analyzed.Inform the students that there is an Excel Guide at the end of each chapter. Stronglyencourage or require students to read the Excel Guide at the end of this chapter so that they willbe ready to use Excel with this book.

Page 10

Statistics For Managers Using Microsoft Excel, Global 8th Edition Solution Manual - Page 10 preview image

Loading page ...

Chapter 1You need tocontinue thediscussion of the Define task byestablishing thetypes ofvariables.Be sure to discuss the different types carefully since the ability to distinguish betweencategorical and numerical data will be crucial later in thecourse. Go over examples of each typeof variable and have students provide examples of each type.Then, if you wish, you can cover thedifferent measurement scales.Then move on to the C of the DCOVA approach, collecting data. Mention the differentsources of data and make sure to cover the fact that data often needs to be cleaned of errors.Then, you couldspend some time discussing sampling,youmay want to take a bit more time anddiscuss the types of survey sampling methods and issues involved with survey sampling results.TheConsiderThisessay discusses the important issue of the use of Web-based surveys.The chapter also introducestwocontinuing casesrelated toManagingAshlandMultiComm ServicesandCardioGood Fitnessthat appear at the end of many chapters.TheDigitalcases are introduced in this chapter also. In these cases, students visit Web sitesrelated to companies and issues raised in the Using Statistics scenarios that start eachchapter. The goal of theDigitalcases is for students to develop skills neededto identifymisuses of statistical information. As would be the situation with manyreal world cases,inDigitalcases,students often need to sift through claims and assorted information inorder to discover the data most relevant to a case task. They will then have to examinewhether the conclusions and claims are supported by the data. (Instructional tips for usingtheManagingAshland MultiComm ServicesandDigitalcases and solutions to theManagingAshland MultiComm ServicesandDigital cases are included in thisInstructor’sSolutions Manual.).Make sure that students read the Excel Guide at the end ofeachchapter.Ways ofWorking With Excel on pages 7 and 8explains the different type of Excel instructions.TheWorkbookinstructions provide step-by-step instructions and live worksheets thatautomatically update when data changes. ThePHStat2add-ininstructions provideinstructions for using the PHStat2 add-in.Analysis ToolPakinstructions provideinstructions for using the Analysis ToolPak, the Excel add-in packagethat is includedwith many versions of Excel.

Page 11

Statistics For Managers Using Microsoft Excel, Global 8th Edition Solution Manual - Page 11 preview image

Loading page ...

Chapter 2This chapter moves on to the organizing and visualizing steps of the DCOVAframework. If you are going to collect sample data to use inChapters2 and 3, you canillustratesampling by conducting a survey of students in your class.Ask each student tocollect his or her own personal data concerning the time it takes to get ready to go to classin the morning or the time it takes to get to school or home from school. First, ask thestudents to write down a definition of how they plan to measure this time. Then, collectthe various answers and read them to the class. Then, a single definition could beprovided (such as the time to get ready is the time measured from when you get out ofbed to when you leave your home, recorded to the nearest minute). In the next class,select a random sample of students and use the data collected (depending on the samplesize) in class when Chapters 2 and 3 are discussed.Then, move on to the Organize step that involves setting up your data in an Excelworksheet and develop tables to help you prepare charts and analyze your data. Beginyour discussion for categorical data with the example on p.34concerninghow peoplepay for purchases and other transactions. Show the summary table and then if you wish,explain that you can sometimes organize the data into a two-way table that has onevariable in the row and another in the column.Continue with organizing data (but now for numerical data) by referring to thecost of a restaurant meal on p.38. Show the simple ordered array and how a frequencydistribution, percentage distribution, or cumulative distributioncan summarize the rawdata in a way that is more useful.Now you are ready to tackle the Visualize step.A good way of starting thispart ofthechapter is to display the following quote."A picture is worth a thousand words."Students will almost certainly be familiar with Microsoft®Word andmayhave already usedExcel to construct charts that they have pasted into Word documents.Now you will be usingExcel to construct many different types of charts.Return to thepurchase paymentdata previouslydiscussed and illustrate how a bar chart,pie, and doughnutchart can be constructedusing Excel.Mention the advantages and disadvantagesof each chart. A good example is to show the data on

Page 12

Statistics For Managers Using Microsoft Excel, Global 8th Edition Solution Manual - Page 12 preview image

Loading page ...

incomplete ATM transactions on p.49and how the Pareto chart enables you to focus on the vitalfew categories. If time permits, you can discuss the side-by-side bar chart for a contingency table.To examine charts for numerical variables you can either use the restaurant datapreviously mentioned, the retirement funds data, ordata that you have collected from your class.You may want to begin with a simple stem-and-leaf display that both organizes the data andshows a bar type chart. Then move on to the histogram and the various polygons, pointing out theadvantages and disadvantages of each.If time permits, you can discuss the scatter plot and the time-series plot for two numericalvariables. Otherwise, you can wait until you get to regression analysis.If you cover the timeseries plot, you might also want to mention sparklines that are discussed in Section 2.6.Also,if possible,you may want to discuss how multidimensional tables allow you to drilldown to individual cells of the table. You can follow this with further discussion of PivotTablesand Excel slicers that enable you to see panels for each variable being studied.If the opportunity is available, we believe that it is worth the time to cover Section 2.7onChallenges inOrganizing andVisualizingVariables. This is a topic that students very much enjoysince it allows for a great deal of classroom interaction. After discussing the fundamentalprinciples ofgoodgraphs, try to illustrate some of the improper displays shown in Figures 2.262.28. Ask students what is “bad” about these figures. Follow up with a homework assignmentinvolving Problems 2.692.73(USA Todayis a great source).You will find that the chapter review problems provide large data sets with numerousvariables. Report writing exercisesprovide the opportunity for students to integrate written and ororal presentation with the statistics they have learned.TheManagingAshland MultiComm Servicescase enables students to examine the use ofstatistics in an actual business environment.TheDigital caserefers to theEndRunFinancialServicesand claims that have been made.The CardioGood Fitness case focuses on developing acustomer profile for a market research team. The Choice Is Yours Follow-up expands on thechapter discussion of the mutual funds data. The Clear Mountain State Student Survey providesdata collected from a sample of undergraduate students.The Excel Guide for this and the remaining chaptersareorganized according to thesections of the chapter. It is quite extensive since it covers both organizing and visualizing manydifferent graphs.The Excel Guideincludes instructions forWorkbook, PHStat2, and the AnalysisToolPak.

Page 13

Statistics For Managers Using Microsoft Excel, Global 8th Edition Solution Manual - Page 13 preview image

Loading page ...

Chapter 3This chapter ondescriptivenumerical statisticalmeasures represents the initialpresentation of statistical symbols in the text. Students who need to review arithmetic andalgebraic conceptsmay wish to refer to AppendixA for a quick review or to appropriate texts(seewww.pearson.com) or videos (www.videoaidedinstruction.com). Once again, as with thetables and chartsconstructed fornumericaldata, it is useful to provide an interesting set of datafor classroomdiscussion.If a sample of students was selected earlier in the semester and dataconcerning student time to get ready or commuting time was collected (see Chapters 1 and 2), usethese data in developing the numerous descriptive summary measures in this chapter. (If theyhave not been developed,useother data for classroom illustration.)Discussion of the chapter begins with the property of central tendency. We have foundthat almost all students are familiar with the arithmetic mean (which they know as the average)and most students are familiar with the median. A good way to begin is to compute themeanforyour classroom example. Emphasize the effect of extreme values on the arithmetic mean andpoint out that themeanis like the center of a seesaw--a balance point. Note that you will returnto this concept later when you discuss the variance and the standard deviation. You might want tointroduce summation notation at this point and express the arithmetic mean in formula notation asin Equation (3.1). (Alternatively, you could wait until you cover the variance and standarddeviation.) A classroom example in which summation notation is reviewed is usually worthwhile.Remind the studentsagainthat Appendix Aincludesa review of arithmetic and algebra andsummation notation [or refer them to other text sources such as those found atwww.pearson.comor videos (seewww. videoaidedinstruction.com)].The next statistic to compute is the median. Be sure to remind the students that themedian as a measure of position must have all the values ranked in order from lowest to highest.Be sure to have the students compare the arithmetic mean to the median and explain that this tellsus something about another property of data (skewness). Following the median, the mode can bebriefly discussed. Once again, have the students compare this result to those of the arithmeticmean and median for your data set.If time permits, you can also discuss the geometric meanwhich is heavily used in finance.The completion of the discussion of central tendencyleadsto the second characteristic ofdata, variability. Mention that all measures of variation have several things in common: (1) theycan never be negative, (2) they will be equal to 0 when all items are the same, (3) they will besmall when there isn't much variation, and (4) they will be large when there isagreat deal ofvariation.

Page 14

Statistics For Managers Using Microsoft Excel, Global 8th Edition Solution Manual - Page 14 preview image

Loading page ...

The first measure of variability to consider is the simplest one, the range. Be sure to pointout that the range only provides information about the extremes, not about the distributionbetween the extremes.Point out thatthe rangelacksone important ingredient, the ability to takeinto account each data value. Bring up the idea of computing the differences around the mean, butthen return to the fact that as the balance point of the seesaw, these differences add up to zero. Atthat point, ask the students whattheycan do mathematically to remove the negative sign for someof the values. Most likely, they will answer by telling you to square them (although someonemay realize that the absolute value could be taken). Next, you may want to define the squareddifferences as a sum of squares. Now you need to have the students realize that the number ofvalues being considered affects the magnitude of the sum of squared differences. Therefore, itmakes sense to divide by the number ofvalues andcomputea measure called the variance. If apopulation is involved, you divide byN, the population size, but if you are using a sample, youdivide byn-1, to make the sample result a better estimate of the population variance. You canfinish the development of variation by noting that since the variance is in squared units, you needto take the square root tocompute the standard deviation.Anothermeasure of variation that can be discussed is the coefficient of variation. Be sureto illustrate the usefulness of this as a measure of relative variation by using an example in whichtwo data sets have vastly different standard deviations, but also vastly different means. A goodexample is one that involves the volatility of stock prices. Point out that the variation of the priceshould be considered in the context of the magnitude of the arithmetic mean.The final measure ofvariation is theZscore. Point out that this provides a measure of variation in standard deviationunits. You can also say that you will return toZscores in Chapter 6 when the normal distributionwill be discussed.You are now ready to move on to the third characteristic of data,shape. Be sure to clearlydefine and illustrate both symmetric and skewed distributions by comparing the mean andmedian.You may also want to briefly mention the property of kurtosis which is the relativeconcentration of values in the center of the distribution as compared to the tails.Thisstatistic isprovided by Excel through an Excel function or theAnalysis Toolpak.Once these three characteristics have been discussed, you are ready to show how they canbe computed using Excel.Now that these measuresare understood, you can further explore data by computing thequartiles, the interquartile range, the five number summary, and constructing a boxplot.Youbegin bydeterminingthe quartiles. Reference here can be made to the standardized exams thatstudents have taken, and the quantile scores that they have received (97th percentile, 48th

Page 15

Statistics For Managers Using Microsoft Excel, Global 8th Edition Solution Manual - Page 15 preview image

Loading page ...

percentile, 12thpercentile,etc.). Explain that the1stand 3rdquartiles are merely two specialquantiles--the 25th and 75th, that unlike the median(the 2ndquartile), are not at the center of thedistribution.Once thequartiles havebeen computed, the interquartile range can be determined.Mentionthat the interquartile range computes the variation in the center of the distribution ascompared to the difference in theextremes computed by the range.You can thendiscussthe five-number summary of minimum value, first quartile, median,third quartile, and maximum value. Then, you construct theboxplot. Present this plot from theperspective of serving as a tool for determining the location, variability, and symmetry of adistribution by visual inspection, and as a graphical tool for comparing the distribution of severalgroups. Itisuseful to display Figure 3.6on page118that indicates the shape of the boxplot forfour different distributions. Then, use PHStat2 toconstructa boxplot. Note thatyou can constructtheboxplot for a single group or for multiple groups.If you desire, you can discuss descriptive measures for a population and introduce theempirical rule and theChebyshevrule.If time permits, and you have covered scatterplots in Chapter 2, you can briefly discussthecovariance and thecoefficient of correlation as a measure of the strength of the associationbetween two numerical variables.Point out that the coefficient of correlation has the advantage ascompared to the covariance of being on a scale that goes from-1 to +1.Figure 3.9on p.127isuseful in depicting scatterplots for different coefficients of correlation.Once again, you will find that the chapter review problems provide large data sets withnumerous variables.TheManagingAshland MultiComm Servicescase enables students to examine the use ofdescriptive statistics in an actual business environment. TheDigital casecontinues the evaluationof theEndRunFinancialServicesdiscussed in theDigital casein Chapter 2.The CardioGoodFitness case focuses on developing a customer profile for a market research team. MoreDescriptiveChoices Follow-up expands on the discussion of the mutual funds data. The ClearMountain State Student Survey provides data collected from a sample of undergraduate students.The Excel Guide for the chapter includes instructions on using different Excel functionsto compute various statistics. Alternatively, you can usePHStat orthe Analysis ToolPak tocompute a list of statistics.PHStat2 can be used to construct a boxplot.

Page 16

Statistics For Managers Using Microsoft Excel, Global 8th Edition Solution Manual - Page 16 preview image

Loading page ...

Chapter 4The chapter on probability represents a bridge between the descriptive statistics alreadycovered and the topics of statistical inference, regression, time series, andbusiness analyticsto becovered in subsequent chapters. In many traditional statistics courses, often a great deal of time isspent on probability topics that are of little direct applicability in basic statistics. The approach inthis text is to cover only those topics that are of direct applicability in the remainder of the text.You need to begin with a relatively concise discussion of some probability rules.Essentially, students really just need to know that (1) no probability can be negative, (2) noprobability can be more than 1, and (3) the sum of the probabilities of a set of mutually exclusiveevents adds to 1.0. Students often understand the subject best if it is taught intuitively with aminimum of formulas, with an example that relates to a business application shown as a two-waycontingency table (see the Using Statistics example). If desired,you can usethe ExcelWorkbookinstructionsorPHStat2 to compute probabilities from the contingency table.Once these basic elements of probability have been discussed, if there is time and youdesire, conditional probability and Bayestheorem(an online topic)can be covered.TheConsiderThisconcerning email SPAM is a wonderful way of helping studentsrealize theapplication of probability to everyday life.Be aware that in a one-semester course where time isparticularly limited, these topics may be of marginal importance.TheDigital casein this chapterextends the evaluation of theEndRunFinancialServicesto consider claims made about variousprobabilities.The CardioGood Fitness, MoreDescriptiveChoices Follow-up, and Clear MountainState Student Survey each involve developing contingency tables to be able to compute andinterpret conditional and marginal probabilities.
Preview Mode

This document has 1341 pages. Sign in to access the full document!