

Solution Manual for Physics: for Scientists and Engineers with Modern Physics, 3rd Edition
- Physics
- 1291 pages
- Shared February 2025
- 136 downloads
Get immediate access to clear and precise solutions with Solution Manual for Physics: for Scientists and Engineers with Modern Physics, 3rd Edition.
Preview 31 of 1291 pages
See the first 31 pages exactly as they appear in the document.
Page 1 Read page 1 as text
I N S T R U C T O R S O L U T I O N S M A N U A L T H I R D E D I T I O N physics F O R S C I E N T I S T S A N D E N G I N E E R S a strategic approach randall d. knight Larry Smith Snow College Brett Kraabel PhD - Physics, University of Santa Barbara Boston Columbus Indianapolis New York San Francisco Upper Saddle River Amsterdam Cape Town Dubai London Madrid Milan Munich Paris Montréal Toronto Delhi Mexico City São Paulo Sydney Hong Kong Seoul Singapore Taipei Tokyo
Page 2 Page 3 Read page 3 as text
Publisher: James Smith Senior Development Editor: Alice Houston, Ph.D. Senior Project Editor: Martha Steele Assistant Editor: Peter Alston Media Producer: Kelly Reed Senior Administrative Assistant: Cathy Glenn Director of Marketing: Christy Lesko Executive Marketing Manager: Kerry McGinnis Managing Editor: Corinne Benson Production Project Man a ger: Beth Collins Production Management, Illustration, and Composition: PreMediaGlobal, Inc. Copyright © 2013, 2008, 2004 Pearson Education, Inc . All rights reserved. Manufactured in the United States of Ame r ica. This publication is protected by Copyright, and permission should be obtained from the publisher prior to any prohibited reproduction, storage in a retrieval system, or transmission in any form or by any means, electronic, m e chanical, photocopying, recording, or likewise. To obtain permission(s) to use material from this work, please submit a written request to Pearson Education, Inc., Permissions Department, 1900 E. Lake Ave., Glenview, IL 60025. For information regarding permissions, call (847) 486 - 2635. Many of the designations used by manufacturers and sellers to distinguish their products are claimed as trad e marks. Where those designations appear in this book, and the publisher was aware of a trademark claim, the designations have been printed in initial caps or all caps. MasteringPhysics is a trademark, in the U.S. and/or other countries, of Pearson Education, Inc. or its affiliates. ISBN 13: 978 - 0 - 321 - 76940 - 4 ISBN 10: 0 - 321 - 76940 - 6 www.pearsonhighered.com
Page 4 Read page 4 as text
Contents Preface ................................ ................................ ................................ ................................ ....... v PART I Newton’s Laws Chapter 1 Concepts of Motion ................................ ................................ .............................. 1 - 1 Chapter 2 Kinematics in One Dime n sion ................................ ................................ ............. 2 - 1 Chapter 3 Vectors and Coordinate Systems ................................ ................................ ......... 3 - 1 Chapter 4 Kinematics in Two Dime n sions ................................ ................................ ........... 4 - 1 Chapter 5 Force and Motion ................................ ................................ ................................ . 5 - 1 Chapter 6 Dynamics I: Motion Along a Line ................................ ................................ ....... 6 - 1 Chapter 7 Newton’s Third Law ................................ ................................ ............................ 7 - 1 Chapter 8 Dynamics II: Motion in a Plane ................................ ................................ ........... 8 - 1 PART II Conservation Laws Chapter 9 Impulse and Momentum ................................ ................................ ...................... 9 - 1 Chapter 10 Energy ................................ ................................ ................................ ................ 10 - 1 Chapter 11 Work ................................ ................................ ................................ .................. 11 - 1 PART III Applications of Newtonian Mechanics Chapter 12 Rotation of a Rigid Body ................................ ................................ ................... 12 - 1 Chapter 13 Newton’s Theory of Gravity ................................ ................................ .............. 13 - 1 Chapter 14 Oscillations ................................ ................................ ................................ ........ 14 - 1 Chapter 15 Fluids and Elasticity ................................ ................................ ........................... 15 - 1 PART IV Thermodynamics Chapter 16 A Macroscopic Description of Matter ................................ ............................... 16 - 1 Chapter 17 Work, Heat, and the First Law of Thermodynamics ................................ .......... 17 - 1 Chapter 18 The Micro/Macro Conne c tion ................................ ................................ ............ 18 - 1 Chapter 19 Heat Engines and Refri g erators ................................ ................................ ......... 19 - 1
Page 5 Read page 5 as text
iv C O N T E N T S Chapter 20 Traveling Waves ................................ ................................ ................................ 20 - 1 Chapter 21 Superposition ................................ ................................ ................................ ..... 21 - 1 Chapter 22 Wave Optics ................................ ................................ ................................ ....... 22 - 1 Chapter 23 Ray Optics ................................ ................................ ................................ .......... 23 - 1 Chapter 24 Optical Instruments ................................ ................................ ............................ 24 - 1 PART VI Electricity and Magnetism Chapter 2 5 Electric Charges and Forces ................................ ................................ ............... 2 5 - 1 Chapter 2 6 The Electric Field ................................ ................................ ............................... 2 6 - 1 Chapter 2 7 Gauss’s Law ................................ ................................ ................................ ....... 2 7 - 1 Chapter 2 8 The Electric Potential ................................ ................................ ......................... 2 8 - 1 Chapter 29 Potential and Field ................................ ................................ ............................. 29 - 1 Chapter 3 0 Current and Resistance ................................ ................................ ...................... 3 0 - 1 Chapter 3 1 Fundamentals of Circuits ................................ ................................ ................... 3 1 - 1 Chapter 3 2 The Magnetic Field ................................ ................................ ............................ 3 2 - 1 Chapter 3 3 Electromagnetic Induction ................................ ................................ ................. 3 3 - 1 Chapter 3 4 Electromagnetic Fields and Waves ................................ ................................ .... 3 4 - 1 Chapter 3 5 AC Circuits ................................ ................................ ................................ ........ 3 5 - 1 PART VII Relativity and Quantum Physics Chapter 3 6 Relativity ................................ ................................ ................................ ............ 3 6 - 1 Chapter 37 The Foundations of Modern Physics ................................ ................................ . 37 - 1 Chapter 38 Quantization ................................ ................................ ................................ ....... 38 - 1 Chapter 39 Wave Functions and Uncertainty ................................ ................................ ....... 39 - 1 Chapter 40 One - Dimensional Quantum Mechanics ................................ ............................. 40 - 1 Chapter 41 Atomic Physics ................................ ................................ ................................ .. 41 - 1 Chapter 42 Nuclear Physics ................................ ................................ ................................ .. 42 - 1 PART V Waves and Optics
Page 6 Read page 6 as text
Preface This Instructor Solutions Manual has a twofold purpose. First, and most obvious, is to pr o- vide worked sol u tions for the use of instructors. Second, but equally important, is to provide examples of good problem - solving techniques and strategies that will benefit your students if you post these solutions. Far too many solutions manuals simply plug numbers into equations, thereby reinforcing one of the worst st u dent habits. The solutions provided here, by contrast, attempt to: • Follow, in detail, the problem - solving strategies presented in the text. • Articulate the reasoning that must be done before computation. • Illustrate how to use drawings effectively. • Demonstrate how to utilize graphs, ratios, units, and the many other “ tactics ” that must be successfully mastered and marshaled if a problem - solving strategy is to be effective. • Show examples of assessing the reasonableness of a solution. • Comment on the significance of a solution or on its relationship to other problems. Most education researchers believe that it is more beneficial for students to study a smaller nu m ber of carefully chosen problems in detail, including variations, than to race through a larger number of poorly understood ca l culations. The solutions presented here are intended to provide a basis for this practice. So that you may readily edit and/or post these solutions, they are available for download as editable Word documents and as pdf files via the “Resources” tab in the textbook ’ s Instru c- tor Resource Center (www.pearsonhighered.com/educator/catalog/index.page) or from the tex t book ’ s Instructor Resource Area in MasteringPhysics ® (www.masteringphysics.com). We have made every effort to be accurate and correct in these solutions. However, if you do find errors or ambiguities, we would be very grateful to hear from you. Please contact your Pea r son Education sales representative.
Page 7 Read page 7 as text
vi P R E F A C E Acknowledgments for the First Edition We are grateful for many helpful comments from Susan Cable, Randall Knight, and Steve Ston e braker. We express appreciation to Susan Emerson, who typed the word - processing manuscript, for her diligence in interpreting our handwritten copy. Finally, we would like to acknowledge the support from the Addison Wesley staff in getting the work into a publis h a- ble state. Our special thanks to Liana Allday, Alice Houston, and Sue Kimber for their wil l- ingness and preparedness in pr o viding needed help at all times. Pawan Kahol Missouri State University Donald Foster Wichita State University Acknowledgments for the Second Edition I would like to acknowledge the patient support of my wife, Holly, who knows what is i m- portant. Larry Smith Snow College I would like to acknowledge the assistance and support of my wife, Alice Nutter, who helped type many pro b lems and was patient while I worked weekends. Scott Nutter Northern Kentucky University Acknowledgments for the Third Edition To Holly, Ryan, Timothy, Nathan, Tessa, and Tyler, who make it all worthwhile. Larry Smith Snow College I gratefully acknowledge the assistance of the staff at Physical Sciences Commun i cation. Brett Kraabel PhD - University of Santa Barbara
Page 8 Read page 8 as text
Conceptual Questions 1.1. (a) 3 significant figures. (b) 2 significant figures. This is more clearly revealed by using scientific notation: 2 sig. figs. 1 0.53 5.3 10 − = (c) 4 significant figures. The trailing zero is significant because it indicates increased precision. (d) 3 significant figures. The leading zeros are not significant but just locate the decimal point . 1.2. (a) 2 significant figures. Traili ng zero s in front of the decimal point merely locate the decimal point and are not significant. (b) 3 significant figures. Trailing zero s after the decimal point are significant because they indicate increased precision. (c) 4 significant figures. (d) 3 significant figures. Trailing zeros after the decimal point are significant because they indicate increased precision. 1.3. Without numbers on the dots we cannot tell if the particle in the figure is moving left or right, so we can’t tell if it is speeding up or slowing down. If the particle is moving to the right it is slowing down. If it is moving to the left it is speeding up. 1.4. Because the velocity vectors get longer for each time step, the object must be speeding up as it travels to the left. The acceleration vector must therefore point in the same direction as the velocity, so the acceleration vector also points to the left. Thus, x a is negative as per our convention (see Tactics Box 1.4). 1.5. Because the velocity vectors get shorter for each time step, t he object must be slowing down as it travels in the y 2 direction (down). The acceleration vector must therefore point in the direction opposite to the velocity; namely, in the + y direction (up). Thus, y a is positive as per our convention (see Tactics Box 1.4). 1.6. The particle position is to the left of zero on the x - axis, so its position is negative. The particle is moving to the right, so its velocity is positive. The particle’s speed is increasing as it moves to the right, so its acceleration vector points in the same direction as its velocity vector (i.e., to the right). Thus, the acceleration is also positive. 1.7. The particle position is below zero on the y - axis, so its position is negative. The particle is moving down, so its velocity is negative. The particle’s speed is increasing as it moves in the negative direction, so its acceleration vector points in the same direction as its velocity vector (i.e., down). Thus, the acceleration is also negative. C ONCEPTS OF M OTION 1
Page 9 Read page 9 as text
1 - 2 Chapter 1 1.8. The particle position is above zero on the y - axis, so its position is positive . The particle is moving down, so its velocity is negative. The particle’s speed is increasing as it moves in the negative direction, so its acceleration vector points in the same direction as its velocity vector (i.e., down). Thus, the acceleration is also negative. Exercises and Problems Section 1.1 Motion Diagrams 1.1. Model : Imagine a car moving in the positive direction (i.e., to the right). As it skids, it covers less distance between each movie frame (or between each snapshot). Solve : Assess: As we go from left to right, the distance between successive images of the car decreases . Because the time interval between each successive image is the same, the car must be slowing down. 1.2. Model: We have no information about the acceleration of the rocket, so we will assume that it accelerates upward with a const ant acceleration. Solve: Assess: Notice that the length of the velocity vectors increases each step by approximately the length of the acceleration vector.
Page 10 Read page 10 as text
Concepts of Motion 1 - 3 1.3. Model: We will assume that the term “quickly” used in the problem statement means a time that is short compared to 30 s. Solve: Assess: Notice that the acceleration vector points in the direction opposite to the velocity vector because the car is decelerating. Section 1.2 The Particle Model 1.4. Solve: (a) The basic idea of the particle model is that we will treat an object as if all its mass is concentrated into a single point. The size and shape of the object will not be considered. This is a reasonable approximation of reality if (i) the distance traveled by the object is large in comparison to the size of the object and (ii) rotations and internal motions are not significant features of the object’s motion. The particle model is important in that it allows us to simplify a problem. Complete reality — which would have to include the motion of every single atom in the object — is too complicated to analyze. By treating an object as a particle, we can focus on the most important aspects of its motion while neglecting minor and unobservable details. (b) The particle model is valid for understanding the motion of a satellite or a car traveling a large distance. (c) The particle model is not valid for understanding how a car engine operates, how a person walks, how a bird flies, or how water flows through a pipe. Section 1.3 Position and Time Section 1.4 Velocity 1.5. Model: We model the ball’s motion from the instant after it is released, when it has zero velocity, to the instant before it hits the ground, when it will have its maximum velocity. Solve:
Page 11 Read page 11 as text
1 - 4 Chapter 1 Assess: Notice that the “particle ” we have drawn has a finite dimensions, so it appears as if the bottom half of this “particle” has penetrated into the ground in the bottom fra me. This is not really the case; our mental particle has no size and is located at the tip of the velocity vector arrow . 1.6. Solve: The player starts from rest and moves faster and faster . 1.7. Solve: The player starts with an initial velocity but as he slides he moves slower and slower until coming to rest . Section 1.5 Linear Acceleration 1.8. Solve: (a) Let 0 v be the velocity vector between points 0 and 1 and 1 v be the velocity vector between points 1 and 2. Speed 1 v is greater than speed 0 v because more distance is covered in the same interval of time. (b) To find the acceleration, use the method of Tactics Box 1.3: Assess: The acceleration vector points in the same direction as the velocity vectors, which makes sense because the speed is increasing. 1.9. Solve: (a) Let 0 v be the velocity vector between points 0 and 1 and 1 v be the velocity vector between points 1 and 2. Speed 1 v is greater than speed 0 v because more distance is covered in the same interval of time. (b) Acceleration is found by the method of Tactics Box 1.3. Assess: The acceleration vector points in the same direction as the velocity vectors, which makes sense because the speed is increasing.
Page 12 Read page 12 as text
Concepts of Motion 1 - 5 1. 10 . Solve: (a) (b) 1.11. Solve: (a) (b) 1.12. Model: Represent the car as a particle. Visualize: The dots are equally spaced until brakes are applied to the car. Equidistant dots on a single line indicate cons tant average velocity . Upo n braking, the dots get closer as the average velocity decreases, and the distance between dots changes by a constant amount because the acceleration is constant. 1.13. Model: Represent the (child + sl ed) system as a particle. Visualize: The dots in the figure are equally spaced until the sled encounters a rocky patch. Equidistant dots on a single line indicate constant average velocity . On encountering a rocky patch, the average velocity decreases and the sled comes to a stop. This part of the motion is indicated by a decreasing separation between the dots. 1.14 . Model: Represent the wad of paper as a particle. Ignore air resistance.
Page 13 Read page 13 as text
1 - 6 Chapter 1 Visualize: The dots become more closely spaced because the particle experiences a downward acceleration . The distance between dots changes by a constant amount because the acceleration is constant. 1.15. Model: Represent the tile as a particle. Visualize: Starting from rest, the tile’s velocity increases until it hits t he water surface. This part of the motion is represented by dots with increasing separation, indicating increasing average velocity. After the tile enters the water, it settles to the bottom at roughly constant speed, so this part of the motion is represented by equally spaced dots. 1.16. Model: Represent the tennis ball as a particle. Visualize: The ball falls freely for three stories. Upon impact, it quickly decelerates to zero velocity while comp - ressing, then accelerates rapidly while re - expanding. As vectors, both the deceleration and acceleration are an upward vector. The downward and upward motions of the ball are shown separately in the figure. The increasing length between the dots during downward motion indicates an increasing average velocity or downward acceleration. On the other hand, the decreasing length between the dots during upward motion indicates acceleration in a d irection opposite to the motion, so the average velocity decreases. Assess: For free - fall motion, acceleration due to gravity is always vertically downward. Notice that the acceleration due to the ground is quite large (although not to scale — that would take too much space) because in a time interval much shorter than the time interval between the points, the velocity of the ball is essentially completely reversed.
Page 14 Read page 14 as text
Concepts of Motion 1 - 7 1.17. Model: Represent the toy car as a particle. Visualize: As the toy car rolls down the ramp, its speed increases. This is indicated by the increasing length of the velocity arrows. That is, motion down the ramp is under a constant acceleration a At the bottom of the ram p, the toy car continues with a constant velocity and no acceleration . Section 1.6 Motion in One Dimension 1.18. Solve: (a) Dot Time (s) x (m) (b) 1 0 0 2 2 30 3 4 95 4 6 215 5 8 400 6 10 510 7 12 600 8 14 670 9 16 720 1.19. Solve: A forgetful physics professor is walk ing from one class to the next . Walking at a constant speed , he covers a distance of 100 m in 2 00 s. He then st ops and chats with a student for 2 00 s. Suddenly, he realizes he is going to be late for his next class, so the hurries on and covers the remaining 200 m in 200 s to get to class on time. 1.20. Solve: Forty miles into a car trip north from his home in El Dorado, an absent - minded English professor stopped at a rest area one Saturday. After staying there for one hour, he headed back home thinking that he was supposed to go on this trip on Sunday. Absent - mindedly he missed his exit and stopped after one hour of driving at another rest area 20 miles south of El Dorado. After waiting there for one hour, he drove back very slowly, confused and tired as he was, and reached El Dorado two hours later . Section 1.7 Solving Problems in Physics 1.21. Visualize: The bicycle move forward with an acceleration of 2 1.5 m/s . Thus, the velocity will increase by 1.5 m/s each second of motion.
Page 15 Read page 15 as text
1 - 8 Chapter 1 1.22. Visualize: The rocket moves upward with a constant acceleration . a The final velocity is 200 m/s and is reached at a height of 1.0 km. Section 1.8 Units and Significant Figures 1.23. Solve: (a) 3 3 1s 6.15 ms (6 15 ms) 6.15 10 s 10 ms − = = (b) 3 3 10 m 27.2 km (27 2 km) 27.2 10 m 1 km = = (c) 3 km 10 m 1 hour 112 km/hour 112 31.1 m/s hour 1 km 3600 s = = (d) 3 2 6 m 1 m 10 ms 72 m/ms 72 7.2 10 m/s ms 1 s 10 m − = = 1.24. Solve: (a) 2 2.54 cm 10 m 8.0 inch (8 0 inch) 0.20 m 1 inch 1 cm − = = (b) feet 12 inch 1 m 66 feet/s 66 20 m/s s 1 foot 39.37 inch = = (c) 3 miles 1.609 km 10 m 1 hour 60 mph 60 27 m/s hour 1 mile 1 km 3600 s = = (d) 2 2 3 2 3 1 m 14 square inches (14 inch ) 9.0 10 m 9.0 10 square meters 39.37 inches − − = = =
Page 16 Read page 16 as text
Concepts of Motion 1 - 9 1.25. Solve: (a) 4 3600 s 3 hour (3 hour) 10,800 s 1 10 s 1 hour = = (b) 5 5 24 hours 3600 s 2 day (2 day) 1.73 10 s 2 10 s 1 day 1 hour = = (c) 4 7 7 365.25 days 8.64 10 s 1 year (1 year) 3 16 10 s 3 10 s 1 year 1 day = = (d) ft 12 inch 1 m 215 ft/s 215 65.5 m/s s 1 ft 39.37 inch = = Assess: The results are given to appropriate number of significant figures. 1.26. Solve: (a) 1 m 20 ft (20 ft) 7 m 3 ft (b) 1 km 1000 m 60 miles (60 miles) 100,000 m 0.6 miles 1 km (c) 1 m/s 60 mph (60 mph) 30 m/s 2 mph (d) 2 1 cm 10 m 8 in (8 in) 0.2 m 1/2 in 1 cm − 1.27. Solve: (a) 4 in 30 cm (30 cm) 12 in 10 cm (b) 2 mph 25 m/s (25 m/s) 50 mph 1 m/s (c) 0.6 mi 5 km (5 km) 3 mi 1 km (d) 1/2 in 0.5 cm (0 5 cm) 0.3 in 1 cm 1.28. Solve: (a) 33.3 25.4 846 = (b) 33.3 25.4 7.9 − = (c) 33.3 5.77 = (d) 333.3 25.4 13.1 = 1.2 9 . Solve: (a) 3 3 (12.5) 1.95 10 . = (b) 12.5 5.21 65.1 = (c) 12.5 1.2 3.54 1.2 2.3 − = − = (d) 1 2 12.5 1.00/12.5 0.0800 8.00 10 − − = = = 1.30. Solve: The length of a typical car is 15 ft or 12 inch 1 m (15 ft) 4.6 m 1 ft 39.37 inch = This length of 15 ft is approximately two - and - a - half times my height.
Page 17 Read page 17 as text
1 - 10 Chapter 1 1.31. Solve: The height of a telephone pole is estimated to be around 50 ft or ( using 1 m ~ 3 ft ) about 15 m. This height is approximately 8 times my height. 1.32. Solve: I typically take 15 minutes in my car to cover a distance of approximately 6 miles from home to campus. My average speed is 6 miles 60 min 0.447 m/s 24 mph (24 mph) 11 m/s 15 min 1 hour 1 mph = = = 1.33. Solve: My barber trims about an inch of hair when I visit him every month for a haircut. The rate of hair growth is 2 9 6 9 1inch 2.54 cm 10 m 1 month 1 day 1 h 9.8 10 m/s 1 month 1 inch 1 cm 30 days 24 h 3600 s m 10 m 3600 s 9.8 10 40 m/h s 1 m 1 h − − − = = 1.34. Model: Represent the Porsche as a particle for the motion diagram. Assume the car moves at a constant speed when it coasts. Visualize: 1.35. Model: Represent the jet as a particle for the motion diagram. Visualize:
Page 18 Read page 18 as text
Concepts of Motion 1 - 11 1.36. Model: Represent (Sam + car) as a particle for the motion diagram. Visualize: 1.37. Model: Represent the wad as a particle for the motion diagram. Visualize:
Page 19 Read page 19 as text
1 - 12 Chapter 1 1.38 . Model: Represent the speed skater as a particle for the motion diagram. Visualize: 1.39. Model: Represent Santa Claus as a particle for the motion diagram. Visualize:
Page 20 Read page 20 as text
Concepts of Motion 1 - 13 1.40 . Model: Represent the motorist as a particle for the motion diagram. Visualize: 1.41. Model: Represent the car as a particle for the motion diagram. Visualize: 1.42. Model: Represent Bruce and the puck as particles for the motion diagram. Visualize:
Page 21 Read page 21 as text
1 - 14 Chapter 1 1.43. Model: Represent the cars of David and Tina and as particles for the motion diagram. Visualize: 1.44. Solve: Isabel is the first car in line at a stop light. When it turns green, she accelerates, hoping to make the next stop light 100 m away before it turns red. When she’s about 30 m away, the light turns yellow, so she starts to brake, knowing that she cannot make the light. 1.45. Solve: A car coasts along at 30 m/s and arrives at a hill . The car decelerates as it coasts up the hill. At the top, the road levels and the car continues coasting along the road at a reduced speed. 1.46. Solve: A skier starts from rest down a 25 ° slope with very little friction. At the bottom of the 100 - m slope the terrain becomes flat and the skier continues at constant velocity. 1.47. Solve: A ball is dropped from a height to check its rebound properties. It rebounds to 80% of its original height. 1.48. Solve: Two boards lean against each other at equal angles to the vertical direction. A ball rolls up the incline, over the peak, and down the other side. 1.49. Solve: (a) (b) A train moving at 100 km/hour slows down in 10 s to a speed of 60 km/hour as it enters a tunnel. The driver maintains this constant speed for the entire length of the tunnel that takes the train a time of 20 s to traverse. Find the length of the tunnel.
Page 22 Read page 22 as text
Concepts of Motion 1 - 15 (c) 1.50. Solve: (a) (b) Sue passes 3 rd Street doing 30 km/ h, slows steadily to the stop sign at 4 th Street, stops for 1 .0 s, then speeds up and reaches her original speed as she passes 5 th Street. If the blocks are 50 m long, how long does it take Sue to drive from 3 rd Street to 5 th Street? (c) 1.51. Solve: (a) (b) Jeremy has perfected the art of steady acceleration and deceleration. From a speed of 60 mph he brakes his car to rest in 10 s with a constant deceleration. Then he turns into an adjoining street. Starting from rest, Jeremy accelerates with exactly the same magnitude as his earlier deceleration and reaches the same speed of 60 mph over the same distance in exactly the same time. Find the car’s acceleration or deceleration.
Page 23 Read page 23 as text
1 - 16 Chapter 1 (c) 1.52. Solve: (a) (b) A coyote (A) sees a rabbit and begins to run toward it with an acceleration of 3.0 2 m/s . At the same instant, the rabbit (B) begins to run away from the coyote with an acceleration of 2.0 2 m/s . The coyote catches the rabbit after running 40 m. How far away was the rabbit when the coyote first saw it? (c) 1.53. Solve: Since area equals length 3 width, the smallest area will correspond to the smaller length and the smaller width. Similarly, the largest area will correspond to the larger length and the larger width. Therefore, the smallest area is (64 m)(100 m) = 6.4 3 2 10 m 3 and the largest area is (75 m)(110 m) = 8.3 3 3 2 10 m . 1.54. Solve: (a) We need 3 kg/m . There are 100 cm in 1 m. If we multiply by 3 3 100 cm (1) 1 m = we do not change the size of the quantity, but only the number in terms of the new unit. Thus, the mass density of aluminum is 3 3 3 3 3 kg 100 cm kg 2.7 10 2.7 10 1 m cm m − =
Page 24 Read page 24 as text
Concepts of Motion 1 - 17 (b) Likewise, the mass density of alcohol is 3 3 3 g 100 cm 1 kg kg 0.81 810 1 m 1000 g cm m = 1.55. Model: In the particle model, the car is represented as a dot. Solve: ( a ) Time t (s) Position x (m) (b) 0 1200 10 975 20 825 30 750 40 700 50 650 60 600 70 500 80 300 90 0 1.56. Solve: Susan enters a classroom, sees a seat 40 m directly ahead, and begins walking toward it at a constant leisurely pace, covering the first 10 m in 10 seconds. But then Susan notices that Ella is heading toward the same seat, so Susan walks more quickly to cover the remaining 30 m in another 10 seconds, beating Ella to the seat. Susan stands next to the seat for 10 seconds to remove her backpack. 1.57. Solve: A crane operator starts lifting a ton of bricks off the ground. In 8 s , he has lifted them to a height of 15 m, then he takes 4 s to make a safety check. He then continues raising the bricks the remaining 15 m, which takes 4 s .
Page 25 Page 26 Read page 26 as text
Conceptual Questions 2.1. It was a typical summer day on the interstate. I started 10 mi east of town and drove for 20 min at 30 mph west to town. My stop for gas took 10 min. Then I headed back east at 60 mph before I encountered a construction zone. Traffic was at a standstill for 10 min and then I was able to move forward (east) at 30 mph until I got to my destination 30 mi east of town. 2.2. With a slow start out of the blocks, a super sprinter reached top speed in about 5 s, having gone only 30 m. He was still able to finish his 100 m in only just over 9 s by running a world record pace for the rest of the race. 2.3. The baseball team is warming up. The pitcher (who is 50 feet from home plate) lobs the ball at 100 ft/s to the second baseman who is 100 ft from home plate. The second baseman then fires the ball at 200 ft/s to the catcher at home plate. 2.4. (a) At 1 s, t = the slope of the line for object A is greater than that for object B. Therefore, object A ’ s speed is greater. (Both are positive slopes.) (b) No, the speeds are never the same. Each has a constant speed (constant slope) and A ’ s speed is always greater. 2.5. (a) A ’ s speed is greater at 1 s. t = The slope of the tangent to B ’ s curve at 1 s t = is smaller than the slope of A ’ s line. (b) A and B have the same speed at just about 3 s. t = At that time, the slope of the tangent to the curve representing B ’ s motion is equal to the slope of the line representing A. 2.6. (a) B. The object is still moving, but the magnitude of the slope of the position - versus - time curve is smaller than at D. (b) D. The slope is greatest at D. (c) At points A, C, and E the slope of the curve is zero, so the object is not moving. (d) At point D the slope is negative, so the object is moving to the left. 2.7. (a) The slope of the position - versus - time graph is greatest at D, so the object is moving fastest at this point. (b) The slope is negative at points C, D, and E, meaning the object is moving to the left at these points. (c) At point C the slope is increasing in magnitude (getting more negative), meaning that the object is speeding up to the left. (d) At point B the object is not moving since the slope is zero. Before point B, the slope is positive, while after B it is negative, so the object is turning around at B. 2.8. (a) The positions of the third dots of both motion diagrams are the same, as are the sixth dots of both, so cars A and B are at the same locations at the time corresponding to dot 3 and again at that of dot 6. (b) The spacing of dots 4 and 5 in both diagrams is the same, so the cars are traveling at the same speeds between times corresponding to dots 4 and 5. K INEMATICS IN O NE D IMENSION 2
Page 27 Read page 27 as text
2 - 2 Chapter 2 2.9. No, though you have the same position along the road, his velocity is greater because he is passing you. If his velocity were not greater, then he would remain even with the front of your car. 2.10. Yes. The acceleration vector will point west when the bicycle is slowing down while traveling east. 2.11 . (a) As a ball tossed upward moves upward, its vertical velocity is positive, while its vertical acceleration is negative, opposite the velocity, causing the ball to slow down. (b) The same ball on its way down has downward (negative) velocity. The downward negative acceleration is pointing in the same direction as the velocity, causing the speed to increase. 2.12. For all three of these situations the acceleration is equal to g in the downward direction. The magnitude and direction of the velocity of the ball do not matter. Gravity pulls down at constant acceleration. (Air friction is ignored.) 2.13. (a) The magnitude of the acceleration while in free fall is equal to g at all times, independent of the initial velocity. The acceleration only tells how the velocity is changing. (b) The magnitude of the acceleration is still g because the rock is still in free fall. The speed is increasing at the same rate each instant, that is, by the same v each second. 2.14. The ball remains in contact with the floor for a small but noticeable amount of time. It is in free fall when not in contact with the floor. When it hits the floor, it is accelerated very rapidly in the upward direction as it bounces.
Page 28 Read page 28 as text
Kinematics in One Dimension 2 - 3 Exercises and Problems Section 2.1 Uniform Motion 2.1 . M odel: Cars will be treated by the particle model. Visualize : Solve: Beth and Alan are moving at a constant speed, so we can calculate the time of arrival as follows: 1 0 1 0 1 0 1 0 x x x x x v t t t t t v − − = = = + − Using the known values identified in the pictorial representation, we find: Alan 1 Alan 0 Alan 1 Alan 0 Beth 1 Beth 0 Beth 1 Beth 0 400 mile 8:00 AM 8:00 AM 8 hr 4:00 PM 50 miles/hour 400 mile 9:00 AM 9:00 AM 6.67 hr 3:40 PM 60 miles/hour x x t t v x x t t v − = + = + = + = − = + = + = + = (a) Beth arrives first. (b) Beth has to wait Alan 1 Beth 1 20 minutes t t − = for Alan. Assess: Times of the order of 7 or 8 hours are reasonable in the present problem. 2.2. Model: We will consider Larry to be a particle. Visualize:
Page 29 Read page 29 as text
2 - 4 Chapter 2 Solve : Since Larry ’ s speed is constant, we can use the following equation to calculate the velocities: f i s f i s s v t t − = − (a) For the interval from the house to the lamppost: 1 200 m 600 m 200 m/min 9 : 07 9 : 05 v − = = − − For the interval from the lamppost to the tree: 2 1200 m 200 m 333 m/min 9 :10 9 : 07 v − = = + − (b) For the average velocity for the entire run: avg 1200 m 600 m 120 m/min 9 :10 9 : 05 v − = = + − 2.3. Solve: (a) The time for each segment is 1 50 mi/40 mph 5/4 hr t = = and 2 50 mi/60 mph 5/6hr. t = = The average speed to the house is 100 mi 48 mph 5/6 h 5/4 h = + (b) Julie drives the distance 1 x in time 1 t at 40 mph. She then drives the distance 2 x in time 2 t at 60 mph. She spends the same amount of time at each speed, thus 1 2 1 2 1 2 /40 mph /60 mph (2/3) t t x x x x = = = But 1 2 100 miles, x x + = so 2 2 (2/3) 100 miles. x x + = This means 2 60 miles x = and 1 40 miles. x = Thus, the times spent at each speed are 1 40 mi/40 mph 1.00 h t = = and 2 60 mi/60 mph 1.00 h. t = = The total time for her return trip is 1 2 2.00 h. t t + = So, her average speed is 100 mi/2 h 50 mph. = 2.4. Model: The jogger is a particle. Solve: The slope of the position - versus - time graph at every point gives the velocity at that point. The slope at 10 s t = is 50 m 25 m 1.25 m/s 20 s s v t − = = = The slope at 25 s t = is 50 m 50 m 0.0 m/s 10 s v − = = The slope at 35 s t = is 0 m 50 m 5.0 m/s 10 s v − = = − Section 2.2 Instantaneous Velocity Section 2.3 Finding Position from Velocity 2.5. Solve: (a) We can obtain the values for the velocity - versus - time graph from the equation / . v s t =
Page 30 Read page 30 as text
Kinematics in One Dimension 2 - 5 (b) There is only one turning point. At 1 s t = the velocity changes from 20 m/s + to 5 m/s, − thus reversing the direction of motion. At 3 s, t = there is an abrupt change in motion from 5 m/s − to rest, but there is no reversal in motion. 2.6. Visualize: Please refer to Figure EX2.6. The particle starts at 0 10 m x = at 0 0. t = Its velocity is initially in the – x direction. The speed decreases as time increases during the first second, is zero at 1 s, t = and then increases after the particle reverses direction. Solve: (a) The particle reverses direction at 1 s, t = when x v changes sign. (b) Using the equation f 0 x x = + area of the velocity graph between 1 t and f , t 2s 3s 10 m (area of triangle between 0 s and 1 s) (area of triangle between 1 s and 2 s) 1 1 10 m (4 m/s)(1 s) (4 m/s)(1 s) 10 m 2 2 10 m area of trapazoid between 2 s and 3 s 1 10 m (4 m/s 8 m/s)(3 s 2 2 x x = − + = − + = = + = + + − 4s 3s s) 16 m area between 3 s and 4 s 1 16 m (8 m/s 12 m/s)(1 s) 26 m 2 x x = = + = + + = 2.7. Model: The graph shows the assumption that the blood isn ’ t moving for the first 0.1 s nor at the end of the beat. Visualize: The graph is a graph of velocity vs. time, so the displacement is the area under the graph — that is, the area of the triangle. The velocity of the blood increases quickly and decreases a bit more slowly. Solve: Call the distance traveled . y The area of a triangle is 1 2 . BH 1 1 (0.20 s)(0.80 m/s) 8.0 cm 2 2 y BH = = = Assess: This distance seems reasonable for one beat. 2.8. Solve: (a) We can calculate the position of the particle at every instant with the equation f i x x = + area under the velocity - versus - time graph between i t and f t The particle starts from the origin at 0 s, t = so 0 m. i x = Notice that the each square of the grid in Figure EX2.8 has “area” (5 m/s) (2 s) 10 m. = We can find the area under the curve, and thus determine x , by counting squares. You can see that x = 35 m at 4 s t = because there are 3.5 squares under the curve. In addition, 35 m x = at t = 8 s because the 5 m represented by the half square between 4 and 6 s is cancelled by the – 5 m represented by the half square between 6 and 8 s. Areas beneath the axis are negative areas. The particle passes through 35 m x = at 4 s t = and again at 8 s. t = (b) The particle moves to the right for 0 s 6 s, t where the velocity is positive. It reaches a turning point at 40 m x = at 6 s t = The motion is to the left for 6 s t This is shown in the motion diagram below.
Page 31 Read page 31 as text
2 - 6 Chapter 2 Section 2.4 Motion with Constant Acceleration 2.9. Visualize: The object has a constant velocity for 2 s and then speeds up between 2 t = and 4. t = Solve: A constant velocity from 0 s t = to 2 s t = means zero acceleration. On the other hand, a linear increase in velocity between 2 s t = and 4 s t = implies a constant positive acceleration which is the slope of the velocity line. 2.10. Visualize: The graph is a graph of velocity vs. time, so the acceleration is the slope of the graph. Solve: When the blood is speeding up the acceleration is 2 m/s m/s 0.05s y y a t = = = When the blood is s lowing down the acceleration is 2 0.80 m/s 5.3 m/s 0.15 s y y a t − = = = − Assess: 2 16 m/s is an impressive but reasonable acceleration. 2.11. Solve: (a) At 2 0 s, t = the position of the particle is 2 s 2.0 m area under velocity graph from 0 s to 2.0 s 1 2.0 m (4.0 m/s)(2.0 s) 6.0 m 2 x t t = + = = = + = (b) From the graph itself at 2 0 s, t = 4 m/s v = (c) The acceleration is 2 f i 6 m/s 0 m/s 2 m/s 3 s x x x x v v v a t t − − = = = = 2.12. Solve: (a) Using the equation f i x x = + area under the velocity - versus - time graph between i t and f t we have (at 1 s) (at 0 s) area between 0 s and 1 s 2.0 m (4 m/s)(1 s) 6 m x t x t t t = = = + = = = + = Reading from the velocity - versus - time graph, (at 1 s) 4 m/s. x v t = = Also, 2 slope / 0 m/s . x a v t = = = (b) (at 3.0 s) (at 0 s) x t x t = = = + area between 0 s t = and 3 s t = 2.0 m 4 m/s 2 s 2 m/s 1 s (1/2) 2 m/s 1 s 13.0 m = + + + = Reading from the graph, ( 3 s) 2 m/s. x v t = = The acceleration is 2 (at 4 s) (at 2 s) ( 3 s) slope 2 m/s 2 s x x x v t v t a t = − = = = = = −
1260 more pages in the full document
Unlock it once and it stays in your library, ready to chat with or turn into flashcards.
Unlock the full documentMore Physics study materials
See all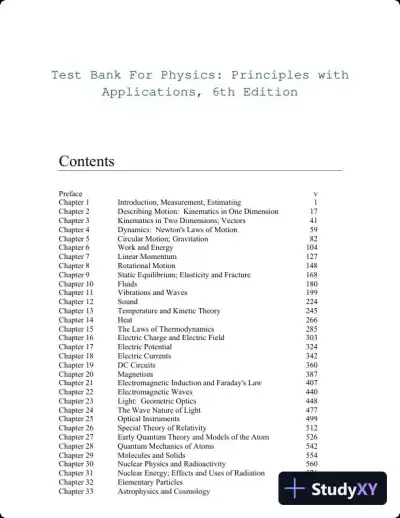 Exam Guides
Test Bank For Physics: Principles with Applications, 6th Edition
Physics
606 pages160downloadsFeb 2025 Textbook Guides
Solution Manual for Modern Physics, 2nd Edition
Physics
187 pages141downloadsFeb 2025 Class Notes
Class Notes for Financial Accounting, 10th Edition
Physics
208 pages139downloadsFeb 2025 Textbook Guides
Solution Manual for E and M TIPERs Electricity And Magnetism: Electricity And Magnetism Tasks: Inspried By Physics Education Research, 1st Edition
Physics
257 pages118downloadsFeb 2025 Textbook Guides
Solution Manual for Financial Accounting, 10th Edition
Physics
1061 pages107downloadsFeb 2025 Exam Guides
Test Bank for Conceptual Physics, 12th Edition
Physics
581 pages71downloadsFeb 2025 Textbook Guides
Solution Manual For College Physics With Masteringphysics, 7th Edition
Physics
536 pages37downloadsFeb 2025 Solved Assignments
Distance Time Velocity Gizmo Handout-2
Physics
7 pagesJun 2025
Study this document with CramX
Once it is in your library, every tool can work from it.