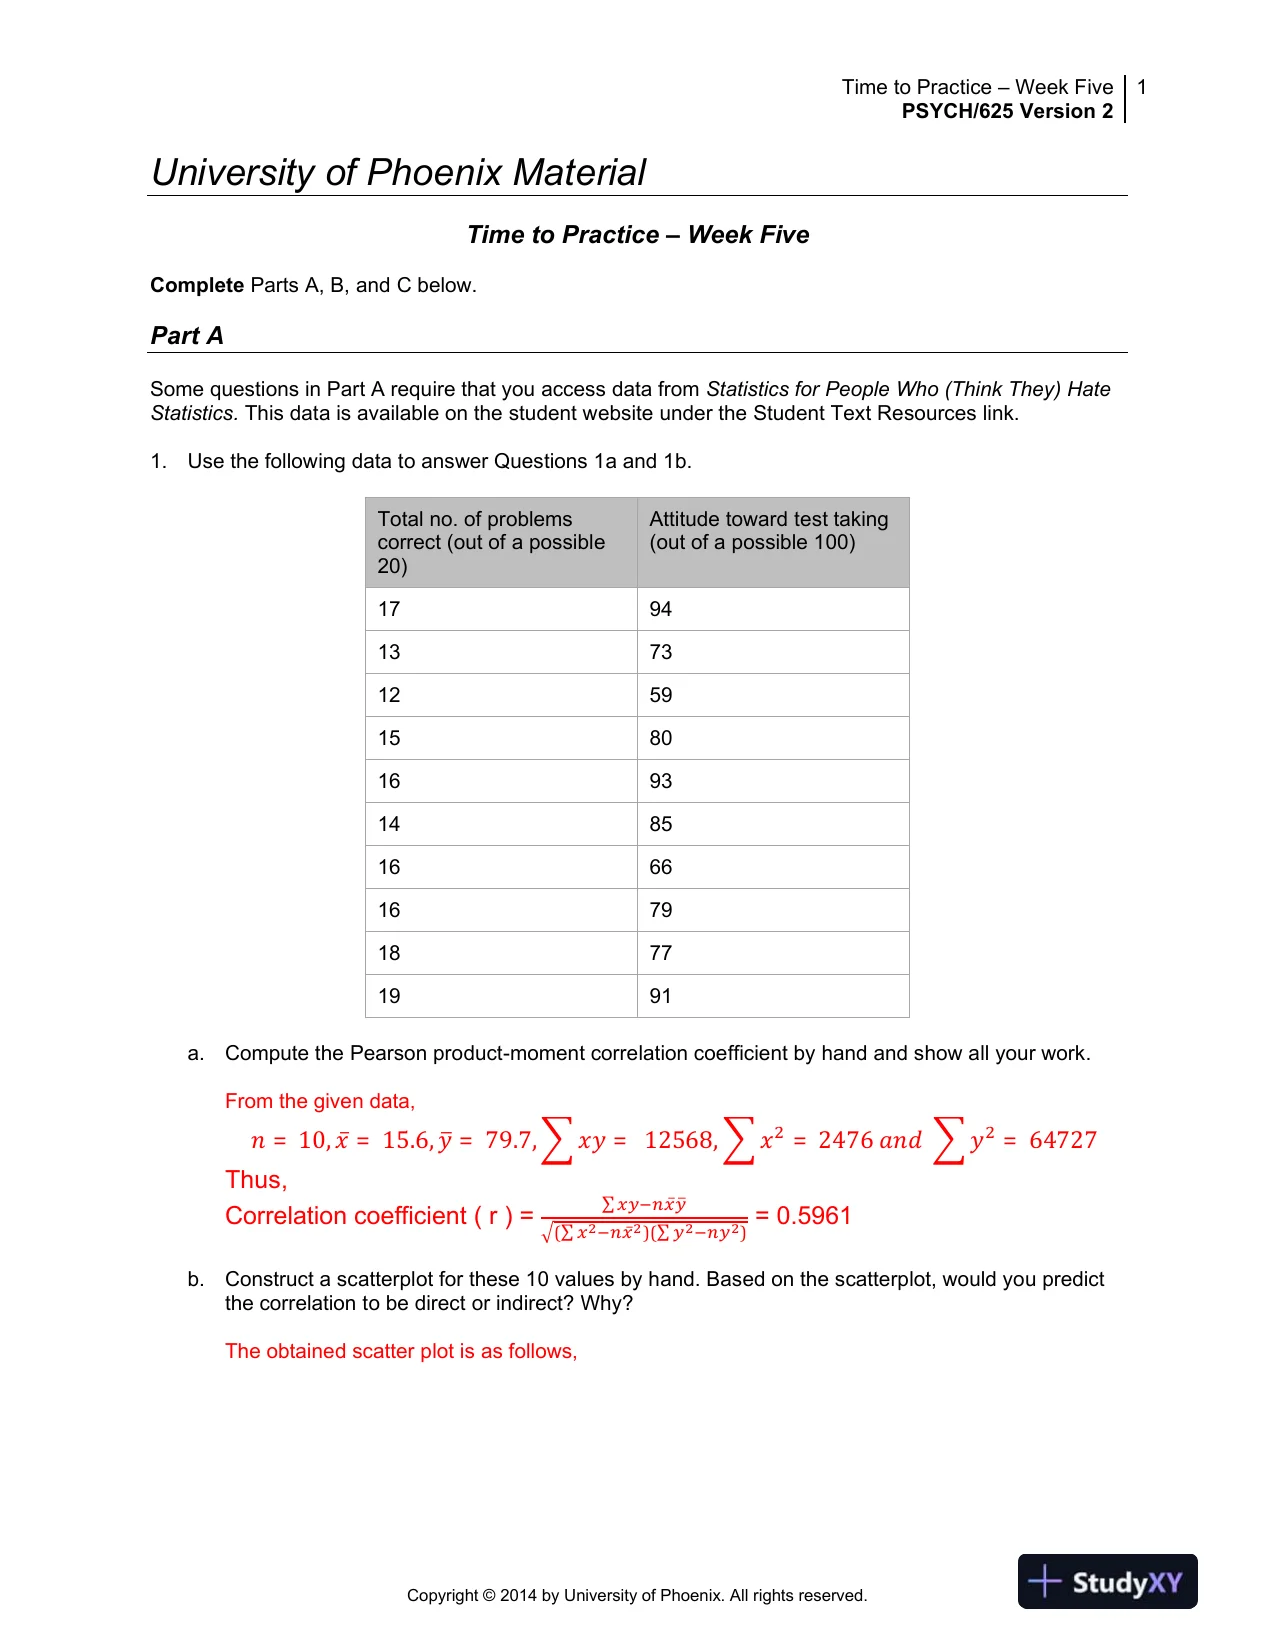
 Time to Practice–Week FivePSYCH/625 Version21Copyright ©2014by University of Phoenix. All rights reserved.University of Phoenix MaterialTime to Practice–Week FiveCompleteParts A, B, and C below.Part ASome questions in Part A require that you access data fromStatistics for People Who (ThinkThey) HateStatistics.This data is available on thestudent website under the Student Text Resources link.1.Usethe followingdata to answer Questions 1a and 1b.Totalno. ofproblemscorrect (out of a possible20)Attitudetowardtesttaking(out of a possible 100)1794137312591580169314851666167918771991a.Compute the Pearson product-moment correlation coefficient by hand and show all your work.From the given data,𝑛=10,𝑥̅=15.6,𝑦ത=79.7,𝑥𝑦=12568,𝑥2=2476𝑎𝑛𝑑𝑦2=64727Thus,Correlation coefficient( r )=∑𝑥𝑦−𝑛𝑥̅𝑦തඥ(∑𝑥2−𝑛𝑥̅2)(∑𝑦2−𝑛𝑦2)= 0.5961b.Construct a scatterplot for these 10 values by hand. Based on the scatterplot, would you predictthe correlation to bedirect or indirect? Why?The obtained scatter plot is as follows,
Preview Mode
This document has 9 pages. Sign in to access the full document!