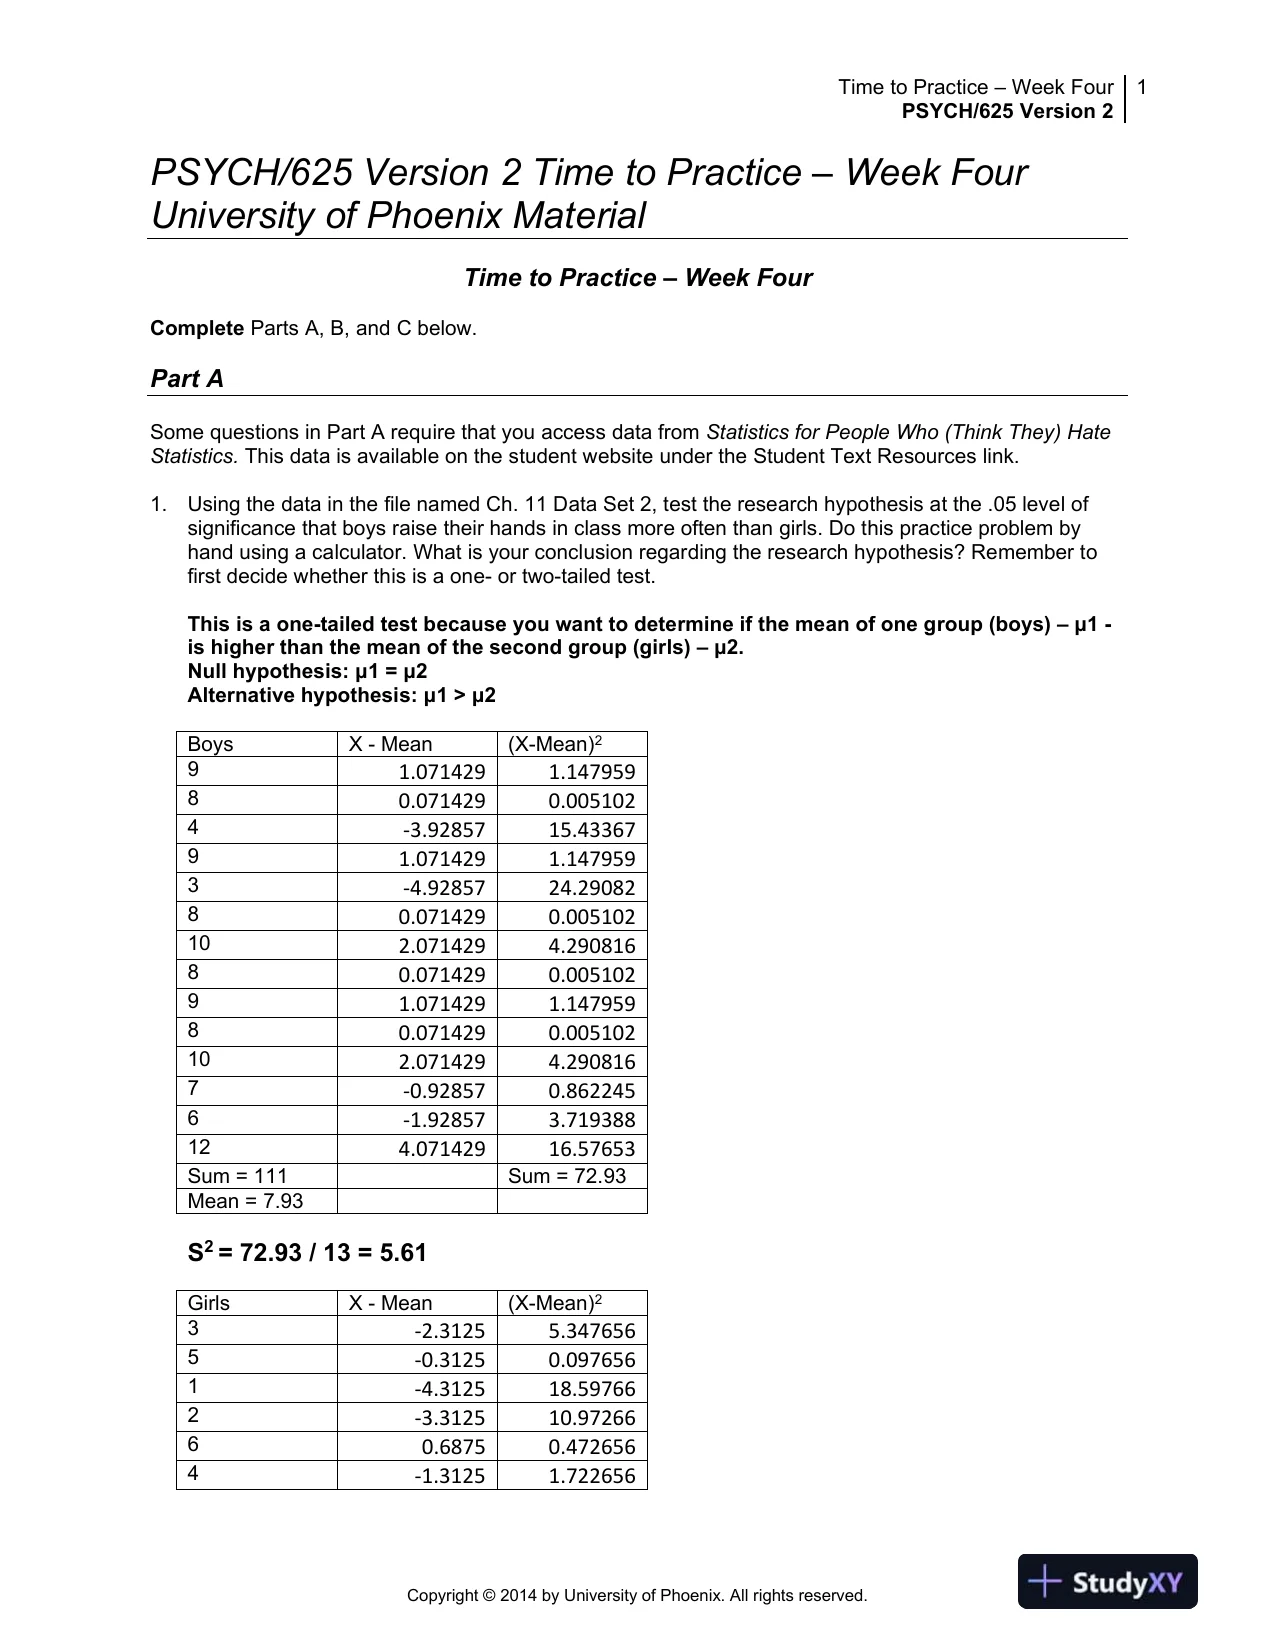
CramX Logo
PSYCH/625 Version 2 Time to Practice � Week Four University of Phoenix Material - Document preview page 1

PSYCH/625 Version 2 Time to Practice � Week Four University of Phoenix Material - Page 1

Document preview content for PSYCH/625 Version 2 Time to Practice � Week Four University of Phoenix Material

PSYCH/625 Version 2 Time to Practice � Week Four University of Phoenix Material

A set of practice problems designed to reinforce psychological concepts from Week Four of PSYCH/625.

Benjamin Clark
Contributor
4.2
0
12 months ago
Preview (5 of 14 Pages)
100%
Log in to unlock
Page 1 of 5
PSYCH/625 Version 2 Time to Practice � Week Four University of Phoenix Material - Page 1 preview imageTime to PracticeWeek FourPSYCH/625 Version 21Copyright ©2014by University of Phoenix. All rights reserved.PSYCH/625 Version 2 Time to PracticeWeek FourUniversity of Phoenix MaterialTime to PracticeWeek FourCompleteParts A, B, and C below.Part ASome questions in Part A require that you access data fromStatistics for People Who (ThinkThey) HateStatistics.This data is available on the student website under the Student Text Resources link.1.Using the data in the file named Ch.11 Data Set 2, test the research hypothesis at the .05 level ofsignificance that boys raise their hands in class more often than girls. Do this practice problem byhand using a calculator. What is your conclusion regarding the research hypothesis? Remember tofirst decide whether this is a one-or two-tailed test.This is a one-tailed test because you want to determine if the mean of one group (boys)μ1-is higher than the mean of the second group(girls)μ2.Null hypothesis:μ1 =μ2Alternativehypothesis:μ1 >μ2BoysX-Mean(X-Mean)291.0714291.14795980.0714290.0051024-3.9285715.4336791.0714291.1479593-4.9285724.2908280.0714290.005102102.0714294.29081680.0714290.00510291.0714291.14795980.0714290.005102102.0714294.2908167-0.928570.8622456-1.928573.719388124.07142916.57653Sum = 111Sum = 72.93Mean = 7.93S2= 72.93 / 13 = 5.61GirlsX-Mean(X-Mean)23-2.31255.3476565-0.31250.0976561-4.312518.597662-3.312510.9726660.68750.4726564-1.31251.722656
Page 2 of 5
PSYCH/625 Version 2 Time to Practice � Week Four University of Phoenix Material - Page 2 preview image
Page 3 of 5
PSYCH/625 Version 2 Time to Practice � Week Four University of Phoenix Material - Page 3 preview imageTime to PracticeWeek FourPSYCH/625 Version 22Copyright ©2014by University of Phoenix. All rights reserved.3-2.31255.34765660.68750.47265671.68752.84765693.687513.5976671.68752.8476563-2.31255.34765671.68752.84765660.68750.47265682.68757.22265682.68757.222656Sum =85Sum = 85.44Mean = 5.31S2= 85.44 / 15 = 5.69Degrees of Freedom Total = 16 + 142 = 28S2pooled = 5.61 (13 / 28) + 5.69 (15 / 28) = 5.658Variance for Boys: S2= 5.658 / n = 5.658 / 14 = 0.404Variance for Girls: S2= 5.658 / n =5.658 / 16 = 0.354S2pop = 0.354 + 0.404 = 0.756S pop = sqrt 0.756 = 0.869T = (7.935.31) / 0.869 = 3.01Looking at the critical values tables, the t-value at 28 degrees of freedom is1.701 at p = 0.05 for a two-tailed test. The calculated t-value is larger so thetest is significant.An independent samples t-test showed that there was a significant differencebetween the mean number of times boys raised their hands in class versusgirls, t(28) = 3.01, 0.005 > p > 0.0025 for a two-tailed test. The p-value would be0.0025 > p > 0.00125 for a one-tailed test. The boys would raise their handsmore in class (M = 7.93, SD =2.37) than girls (M = 5.31, SD = 2.39). We shouldreject the null.2.Practice the following problemsbyhand just to see if you can get the numbers right. Using thefollowing information, calculate thettest statistic.a.𝑋1=62𝑋2=60𝑛1=10𝑛2=10𝑠12=2.45𝑠22=3.16Find the pooled S2= 2.45 (9 / 18) + 3.16 (9 / 18) = 2.45Variance for 1 = 2.45 / 10 = 0.245Variance for 2 = 0.245Pop Variance = 0.245 + 0.245 = 0.49
Page 4 of 5
PSYCH/625 Version 2 Time to Practice � Week Four University of Phoenix Material - Page 4 preview imageTime to PracticeWeek FourPSYCH/625 Version 23Copyright ©2014by University of Phoenix. All rights reserved.Sqrt 0.49 = 0.7T = (6260) / 0.7 = 2.86b.𝑋1=158𝑋2=157.4𝑛1=22𝑛2=26𝑠12=2.06𝑠22=2.59Find the pooled S2=2.06 (21 / 46) + 2.59 (25 / 48) =2.35Variance for 1 = 2.35 / 22 = 0.107Variance for 2 = 2.35 / 26 = 0.0903Pop Variance = 0.107 + 0.0903 = 0.197Sqrt 0.197 = 0.444T = (158157.4)/ 0.444 = 1.35c.𝑋1=200𝑋2=198𝑛1=17𝑛2=17𝑠12=2.45𝑠22=2.35Find the pooled S2=2.45(16/32) +2.35(16/32) =2.40Variance for 1 = 2.45 /17=0.144Variance for 2 = 2.35/ 17 = 0.138Pop Variance = 0.144 + 0.138 = 0.282Sqrt 0.282=0.531T = (200-198)/ 0.531=3.773.Using the results you got from Question2and a level of significance at .05,what are the two-tailedcritical values associated with each? Would the nullhypothesis be rejected?a)Critical value at df = 18 andalpha = 0.05, t = 1.734. The null hypothesiswould be rejected because the calculated t = 2.86 is greater than critical t =1.734b)Critical value at approximate df = 40 and alpha = 0.05, t = 1.684. The nullhypothesis would not be rejected because the calculated t = 1.35 is lessthan critical t = 1.684c)Critical value at approximate df = 30 and alpha = 0.05, t = 1.697. The nullhypothesis would be rejected because the calculated t = 3.77 is greaterthan critical t = 1.6974.Using the data in the filenamed Ch.11 Data Set 3, test the null hypothesis that urban and ruralresidents both have the same attitude toward gun control. UseIBM®SPSS®softwareto complete theanalysis for this problem.Group StatisticsGroupNMeanStd. DeviationStd.Error MeanAttitudeUrban166.51121.77221.44305Rural145.39793.31442.88582
Page 5 of 5
PSYCH/625 Version 2 Time to Practice � Week Four University of Phoenix Material - Page 5 preview imageTime to PracticeWeek FourPSYCH/625 Version 24Copyright ©2014by University of Phoenix. All rights reserved.Independent Samples TestLevene's Test forEquality ofVariancest-test for Equality of MeansFSig.tdfSig. (2-tailed)MeanDifferenceStd. ErrorDifference95% ConfidenceInterval of theDifferenceLowerUpperAttitudeEqual variancesassumed4.463.0441.16828.2531.11339.95311-.838973.06576Equal variancesnot assumed1.12419.273.2751.11339.99044-.957633.18442Anindependent samples t-test was performed on the sample. The mean attitude for urbanresidents (M = 6.51, SD = 1.77) was slightly higher than the mean attitude for rural residents(M=5.40, SD = 3.31). The Levene’s Test was significant, F = 4.463, p = 0.044,which suggests thatthe variances of the two groups are not equal. The t-test was not significant, t (19) = 1.124, p =0.274. There is no difference in attitude on gun control among urban and rural residents. Wewould fail to reject the null.5.In the following examples, indicate whether you would perform attest ofindependent means ordependent means.a.Two groups were exposed to different treatment levels for ankle sprains.Which treatment wasmost effective?A t-test ofindependent means would be used becausethe two groups weremutually exclusive and had different subjects in each group.b.A researcher in nursing wanted to know if the recovery of patients was quicker when somereceived additional in-home care whereas when others received the standard amount.A t-test ofindependent means was used because the groups were independent of each other.c.A group of adolescent boys was offered interpersonal skills counseling andthen tested inSeptember and May to see if there was any impact on familyharmony.A t-test of dependentmeans was used because the same group of boys was tested again at two different timepoints.d.One group of adult men was given instructions in reducing their high bloodpressure whereasanother was not given any instructions.A t-test of independent means was used because twodifferent groups of men are being tested.e.One group of men was provided access to an exercise program and tested twotimes over a 6-month period for heart health.A t-test of dependent means was used because the samegroup of men was tested twice.6.The data set for this problem can be found through the Sage Materials in the Student Textbook
Preview Mode

This document has 14 pages. Sign in to access the full document!