MATLAB for Engineers, 5th Edition Solution Manual

Unlock the answers to every textbook problem with MATLAB for Engineers, 5th Edition Solution Manual, making studying more efficient and effective.

Zoe Jordan
Contributor
4.9
43
10 months ago
Preview (16 of 606 Pages)
100%
Log in to unlock

Page 1

MATLAB for Engineers, 5th Edition Solution Manual - Page 1 preview image

Loading page ...

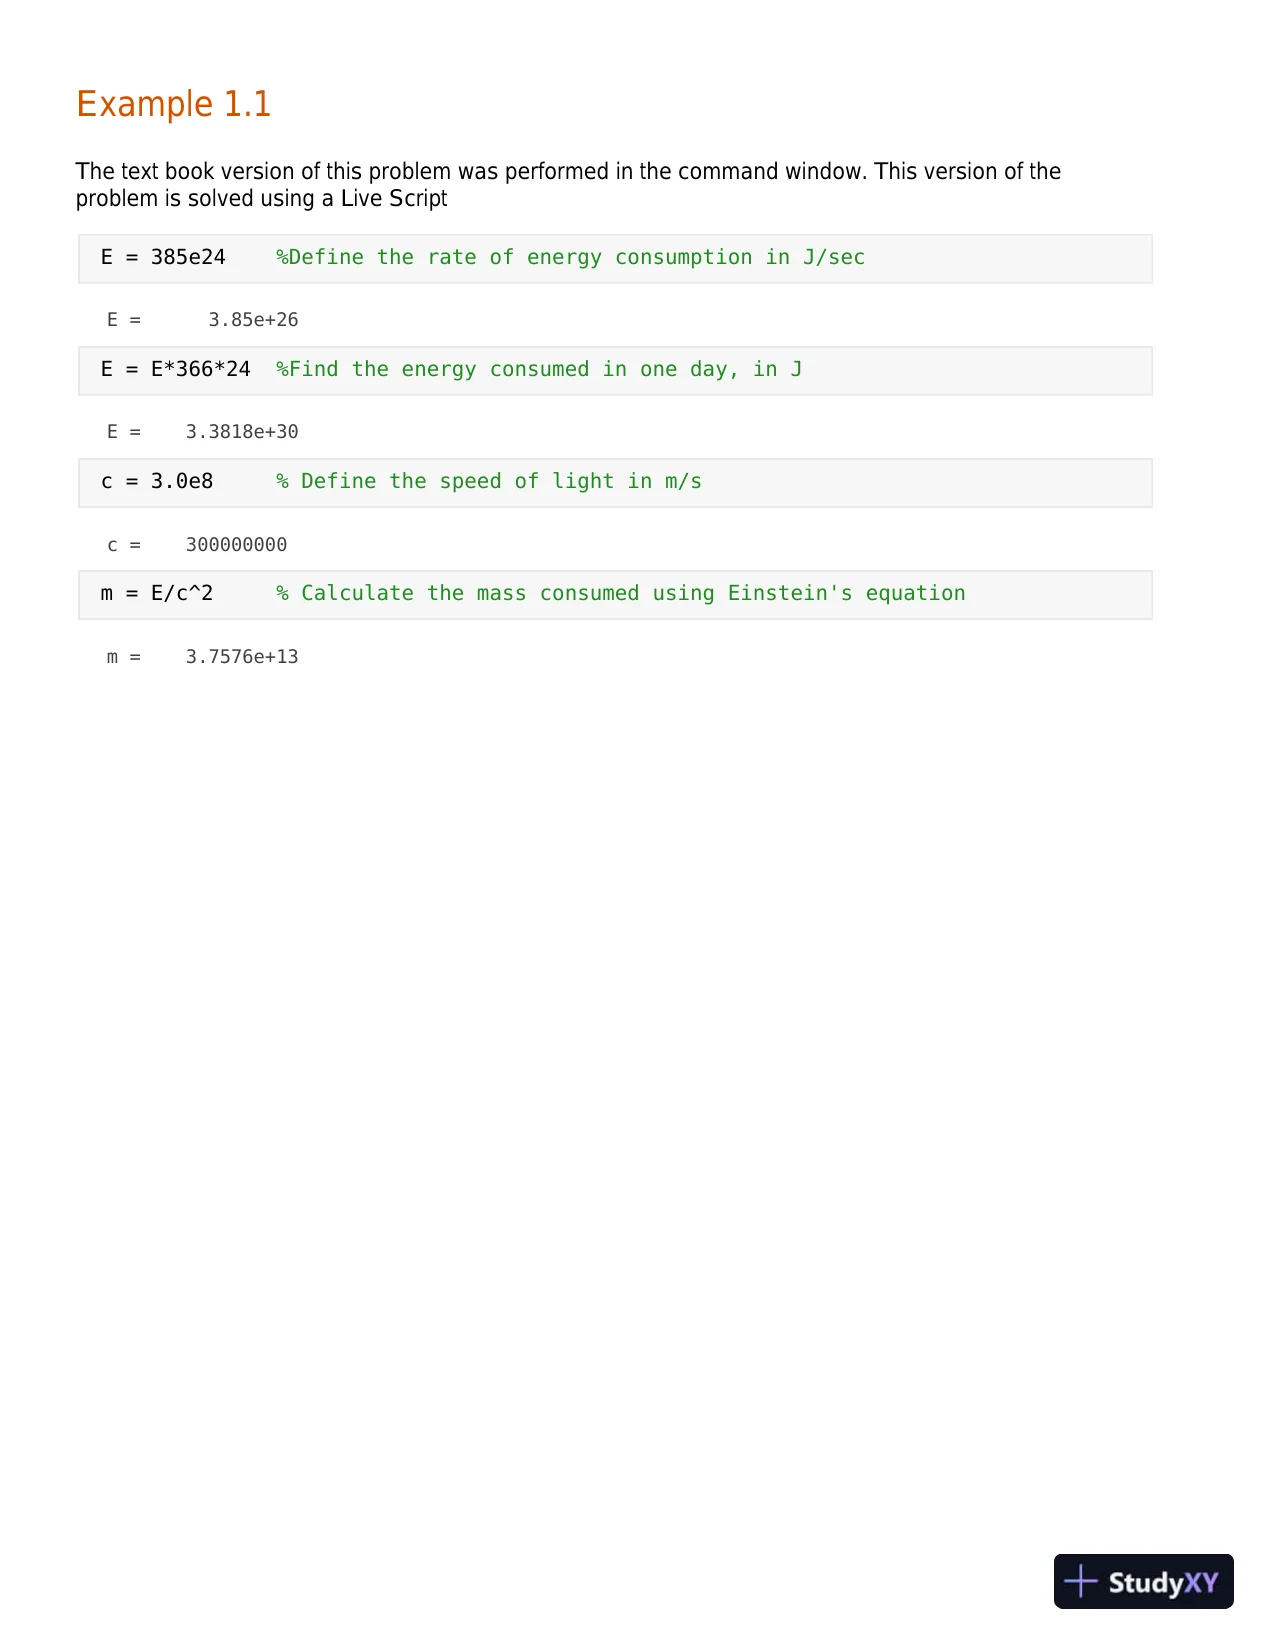
Example 1.1The text book version of this problem was performed in the command window. This version of theproblem is solved using a Live ScriptE=385e24%DefinetherateofenergyconsumptioninJ/secE=3.85e+26E=E*366*24%Findtheenergyconsumedinoneday,inJE=3.3818e+30c=3.0e8%Definethespeedoflightinm/sc=300000000m=E/c^2%CalculatethemassconsumedusingEinstein'sequationm=3.7576e+13

Page 2

MATLAB for Engineers, 5th Edition Solution Manual - Page 2 preview image

Loading page ...

Page 3

MATLAB for Engineers, 5th Edition Solution Manual - Page 3 preview image

Loading page ...

EXAMPLE 2.1SCALAR OPERATIONSWind tunnels (see Figure 2.6) play an important role in our study of the behavior of high-performanceaircraft. In order to interpret wind tunnel data, engineers need to understand how gases behave. Thebasic equation describing the properties of gases is the ideal gas law, a relationship studied in detail infreshman chemistry classes. The law states thatPV=nRTwhereP= pressure in kPa,V= volume in m3,n= number of kmoles of gas in the sample,R= ideal gas constant, 8.314 kPa m3/kmol K, andT= temperature, expressed in kelvins (K).In addition, we know that the number of kmoles of gas is equal to the mass of the gas divided by themolar mass (also known as the molecular weight) orn=m/MWwherem= mass in kg andMW= molar mass in kg/kmol.Different units can be used in the equations if the value ofRis changed accordingly.Figure 2.6Wind tunnels are used to test aircraft designs. (Louis Bencze/Getty Images Inc., StoneAllstock.)Now suppose you know that the volume of air in the wind tunnel is 1000 m3. Before the wind tunnel isturned on, the temperature of the air is 300 K, and the pressure is 100 kPa. The average molar mass(molecular weight) of air is approximately 29 kg/kmol. Find the mass of the air in the wind tunnel.To solve this problem, use the following problem-solving methodology:1.State the ProblemWhen you solve a problem, it is a good idea to restate it in your own words: Find the mass of air in awind tunnel.2.Describe the Input and OutputInputVolumeV= 1000 m3TemperatureT= 300 KPressureP= 100 kPaMolecular weightMW= 29 kg/kmol

Page 4

MATLAB for Engineers, 5th Edition Solution Manual - Page 4 preview image

Loading page ...

Gas constantR= 8.314 kPa m3/kmol KOutputMassm= ? kg3.Develop a Hand ExampleWorking the problem by hand (or with a calculator) allows you to outline an algorithm, which you cantranslate to MATLAB® code later. You should choose simple data that make it easy to check your work.In this problem, we know two equations relating the data:PV=nRTideal gas lawn=m/MWrelationship between mass and molesSolve the ideal gas law forn, and plug in the given values:n=PV/RT= 40.0930 kmolConvert moles to mass by solving the conversion equation for the massmand plugging in the values:m=n× MW = 40.0930 kmol × 29 kg/molm= 1162.70 kg4.Develop a MATLAB® SolutionFirst, clear the screen and memory:clear,clcNow perform the following calculations in the command window:P=100P=100T=300T=300V=1000V=1000MW=29MW=29R=8.314

Page 5

MATLAB for Engineers, 5th Edition Solution Manual - Page 5 preview image

Loading page ...

R=8.314n=(P*V)/(R*T)n=40.093m=n*MWm=1162.7There are several things you should notice about this MATLAB® solution. First, because no semicolonswere used to suppress the output, the values of the variables are repeated after each assignmentstatement. Notice also the use of parentheses in the calculation ofn. They are necessary in thedenominator, but not in the numerator. However, using parentheses in both makes the code easier toread.5.Test the SolutionIn this case, comparing the result with that obtained by hand is sufficient. More complicated problemssolved in MATLAB® should use a variety of input data, to confirm that your solution works in a variety ofcases. The MATLAB® screen used to solve this problem is shown in Figure 2.7.

Page 6

MATLAB for Engineers, 5th Edition Solution Manual - Page 6 preview image

Loading page ...

Figure 2.7MATLAB®screen used to solve the ideal gas problem.Notice that the variables defined in the command window are listed in the workspace window. Noticealso that the command history lists the commands executed in the command window. If you were toscroll up in the command history window, you would see commands from previous MATLAB® sessions.All of these commands are available for you to move to the command window.

Page 7

MATLAB for Engineers, 5th Edition Solution Manual - Page 7 preview image

Loading page ...

Example 2.2clear,clclbf=[0:100:1000];N=lbf*4.44822;[lbf',N']ans=1.0e+03*000.10000.44480.20000.88960.30001.33450.40001.77930.50002.22410.60002.66890.70003.11380.80003.55860.90004.0034

Page 8

MATLAB for Engineers, 5th Edition Solution Manual - Page 8 preview image

Loading page ...

Example 2.3Calculating Dragclear,clc%Findthedragcoefficientdrag=20000;density=0.000001;velocity=100*0.4470;area=1;cd=drag*2/(density*velocity^2*area)cd=2.0019e+07Find drag for a range of velocitiesvelocity=0:20:200;velocity=100*velocity;drag=cd*density*velocity.^2*area/2;my_table=[velocity',drag']my_table=1.0e+09*000.00000.04000.00000.16020.00000.36030.00000.64060.00001.00100.00001.44140.00001.96190.00002.56240.00003.2431

Page 9

MATLAB for Engineers, 5th Edition Solution Manual - Page 9 preview image

Loading page ...

clear,clc%Example2.4%FindthepossibleaccelerationoftheVoyager1%andVoyager2Spacecraftusingtheonboardpower%generatorformatshortgmass=721.9;%massinkgpower=335;%powerinwattsvelocity=[3.53.15];%velocityinAU/year%changethevelocitytom/secvelocity=velocity*150e9/365/24/3600%Calculatetheaccelerationacceleration=power./(mass.*velocity)

Page 10

MATLAB for Engineers, 5th Edition Solution Manual - Page 10 preview image

Loading page ...

Example 3.1Using the Clausius Clapeyron Equation, find the saturation vapor pressure for water at differenttemperatures%clear,clcTempF=[-60:10:120];%DefinetempmatrixinFTempK=(TempF+459.6)/1.8;%ConverttemptoKDelta_H=2.45e6;%DefinelatentheatofvaporizationR_air=461;%Defineidealgasconstantforair%Calculate the Vapor PressuresVapor_Pressure=6.11*exp((Delta_H/R_air)*(1/273-1./TempK));Display the results in a tablemy_results=[TempF',Vapor_Pressure']my_results=-600.06979-500.12521-400.21845-300.37138-200.61633-10101.5888102.4749203.7847305.688408.41025012.2466017.5757024.8818034.7739048.0110065.52611088.461120118.19

Page 11

MATLAB for Engineers, 5th Edition Solution Manual - Page 11 preview image

Loading page ...

Example 3_2clear,clc%DefinetheinputForce=[100,200,50];theta=[-90,+90,+30];%convertanglestoradianstheta=theta*pi/180;%FindthexcomponentsForceX=Force.*cos(theta);%SumthexcomponentsForceX_total=sum(ForceX);%FindandsumtheycomponentsinthesamestepForceY_total=sum(Force.*sin(theta));%Findtheresultingangleinradiansresult_angle=atan(ForceY_total/ForceX_total);%Findtheresultingangleindegreesresult_degrees=result_angle*180/piresult_degrees=70.893%FindthemagnitudeoftheresultingforceForce_total=ForceX_total/cos(result_angle)Force_total=132.29

Page 12

MATLAB for Engineers, 5th Edition Solution Manual - Page 12 preview image

Loading page ...

Example 3.3 - Weather DataIn this example we will find the total precipitationfor each month, and for the entire year, using a data fileWe will also find the month and day on which the precipitation wasthe maximumclcloadweatherdata%Findthesumofeachrow,whichisthesumforeachmonthmonthly_total=sum(weatherdata,2,'omitnan')/100;monthly_total'ans=8.485.153.854.743.216.333.172.782.495.664.682.86%Findtheannualtotalyearly_total=sum(monthly_total)yearly_total=53.4%Findtheannualmaximum,andthedayonwhichitoccurs[max_precip,month]=max(max(weatherdata,[],2,'omitnan'))max_precip=272month=1%Findtheannualmaximum,andthemonthinwhichitoccurs[max_precip,day]=max(max(weatherdata,[],1,'omitnan'))max_precip=272day=3

Page 13

MATLAB for Engineers, 5th Edition Solution Manual - Page 13 preview image

Loading page ...

Example 3.4 Climatological DataInthis example we find the mean dailyprecipitationforeachmonthandthemean daily precipitation for the year.Wealsofindthestandarddeviationofthe dataclear,clc%Changingtheformattoshortg,oftenmakestheoutput%easiertoreadformatshortg%Bysavingthevariableweatherdatafromthelastexample,itis%availabletouseinthisproblemloadweatherdataAverage_daily_precip_monthly=mean(weatherdata','omitnan')Average_daily_precip_monthly=27.35518.39312.41915.810.35521.110.2268.96778.318.25815.69.2258Average_daily_precip_yearly=mean(weatherdata(:),'omitnan')Average_daily_precip_yearly=14.63Now calculate the standard deviationMonthly_Stdeviation=std(weatherdata','omitnan')Monthly_Stdeviation=63.77936.49920.40149.7326.64851.17630.62630.7727.44742.07954.17421.012Yearly_Stdeviation=std(weatherdata(:),'omitnan')Yearly_Stdeviation=39.948

Page 14

MATLAB for Engineers, 5th Edition Solution Manual - Page 14 preview image

Loading page ...

Example 3.5Noiseloadhandel%Loadthemusicdatafilesound(y,Fs)%Playthemusicdatafilepause%Pausetolistentothemusic%Besuretohitentertocontinueafterplayingthemusic%Addrandomnoisenoise=randn(length(y),1)*0.1;sound(y+noise,Fs)%Plotthefirst200datapointsineachfilet=1:length(y);noisy=y+noise;plot(t(1,1:200),y(1:200,1),t(1,1:200),y(1:200,1)+noisy(1:200,1),':')title('Handel''sMessiah')xlabel('ElementNumberinMusicArray')ylabel('Frequency')

Page 15

MATLAB for Engineers, 5th Edition Solution Manual - Page 15 preview image

Loading page ...

Example 4.1Inthis example we extract data fromalargematrix,andusethedataanalysis functions to find the meanhighandmeanlowtemperaturesfortheyear, and to find the high temperatureandthelowtemperaturefortheyearclear,clcload the data matrix from a fileloadasheville_1999extract the mean high temperatures from the large matrixmean_max=asheville_1999(1:12,2);%extractthemeanlowtemperaturesfromthelargematrixmean_min=asheville_1999(1:12,3);%Calculatetheannualmeansannual_mean_max=mean(mean_max)annual_mean_max=68.05annual_mean_min=mean(mean_min)annual_mean_min=46.325%extractthehighandlowtemperaturesfromthelargematrixhigh_temp=asheville_1999(1:12,8);low_temp=asheville_1999(1:12,10);%Findthemaxandmintemperaturefortheyearmax_high=max(high_temp)max_high=96min_low=min(low_temp)min_low=9%Createannewmatrixwithjustthetemperatureinformationnew_table=[mean_max,mean_min,high_temp,low_temp]new_table=51.431.578952.632.1661652.732.5762270.148.283347551.5834080.260.9905085.764.9965686.463945479.154.6913967.645.5782862.240.77626

Page 16

MATLAB for Engineers, 5th Edition Solution Manual - Page 16 preview image

Loading page ...

53.630.56915
Preview Mode

This document has 606 pages. Sign in to access the full document!