CramX Logo
Impact of Course Participation on Creativity and Blood Pressure - Document preview page 1

Impact of Course Participation on Creativity and Blood Pressure - Page 1

Document preview content for Impact of Course Participation on Creativity and Blood Pressure

Impact of Course Participation on Creativity and Blood Pressure

Study analyzing the effects of academic participation on creativity and health.

Violet Stevens
Contributor
4.8
0
12 months ago
Preview (5 of 14 Pages)
100%
Log in to unlock
Page 1 of 5
Impact of Course Participation on Creativity and Blood Pressure - Page 1 preview image
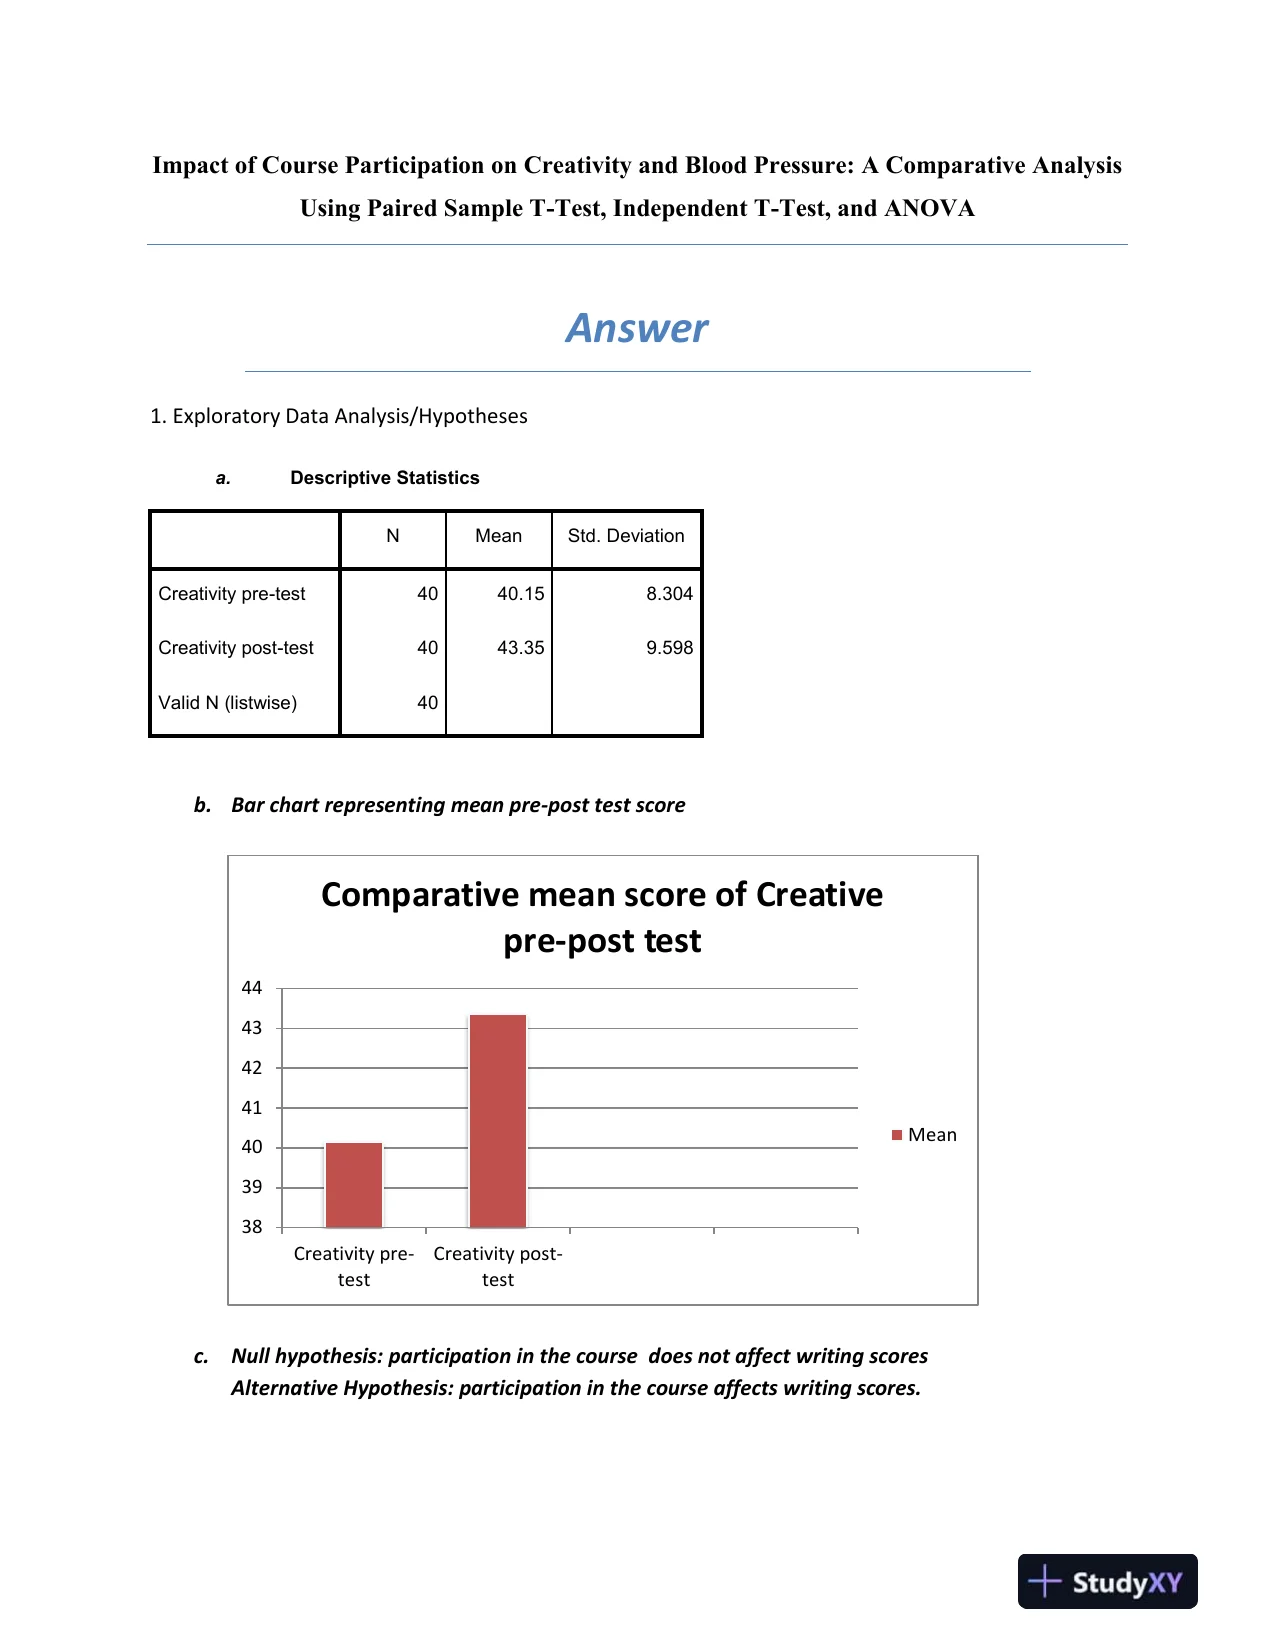
Impact of Course Participation on Creativity and Blood Pressure: A Comparative AnalysisUsing Paired Sample T-Test, Independent T-Test, and ANOVAAnswer1. Exploratory Data Analysis/Hypothesesa.Descriptive StatisticsNMeanStd. DeviationCreativity pre-test4040.158.304Creativity post-test4043.359.598Valid N (listwise)40b.Bar chart representing mean pre-post test scorec.Null hypothesis:participation in the course does not affect writing scoresAlternativeHypothesis: participation in the courseaffectswriting scores.38394041424344Creativity pre-testCreativity post-testComparative mean score of Creativepre-post testMean
Page 2 of 5
Impact of Course Participation on Creativity and Blood Pressure - Page 2 preview image
Page 3 of 5
Impact of Course Participation on Creativity and Blood Pressure - Page 3 preview image2. Comparison of Meansa.Paired Samples StatisticsMeanNStd. DeviationStd. Error MeanPair 1Creativity pre-test40.15408.3041.313Creativity post-test43.35409.5981.518Paired Samples CorrelationsNCorrelationSig.Pair 1Creativity pre-test &Creativity post-test40.650.000Paired Samples TestPaired DifferencesMeanStd. DeviationStd. Error MeanPair 1Creativity pre-test-Creativitypost-test-3.2007.5761.198
Page 4 of 5
Impact of Course Participation on Creativity and Blood Pressure - Page 4 preview imagePaired Samples TestPaired DifferencesT95% Confidence Interval of theDifferenceLowerUpperPair 1Creativity pre-test-Creativity post-test-5.623-.777-2.671Paired Samples TestdfSig.(2-tailed)Pair 1Creativity pre-test-Creativity post-test39.011b. The paired sample t-test analysis indicates thatmean score of Creative post test score(M=43.35) is significantly greater as compare to Creative pre test score (M=40.15). Theresultsalso indicate that there is positive correlation between these two variables (r = 0.650, p<0.001).AsP value (P=0.011) is less than 0.05, so we reject null hypothesis & conclude that participation inthe courseaffectswriting scoressignificantly.Part B Independent t Test1. New dataset is been created & attachedalongwith the wordoutputfile namelyActivity 4b.sav2. Exploratory Data Analysis/Hypothesesa.Descriptive StatisticsNMeanStd. DeviationCreativity Scores8041.759.062Valid N (listwise)80b. Pie chart representing meancreative pre-post test score
Page 5 of 5
Impact of Course Participation on Creativity and Blood Pressure - Page 5 preview imagec.Null hypothesis: participation in thecourse doesnot affect writing scoresAlternative Hypothesis: participation in the courseaffectswriting scores.3. Comparison of meanGroup StatisticsGroupNMeanStd. DeviationStd. Error MeanCreativity ScoresPre-test4040.158.3041.313Post test4043.359.5981.51848%52%Mean Creative test scorePre-testPost-test
Preview Mode

This document has 14 pages. Sign in to access the full document!