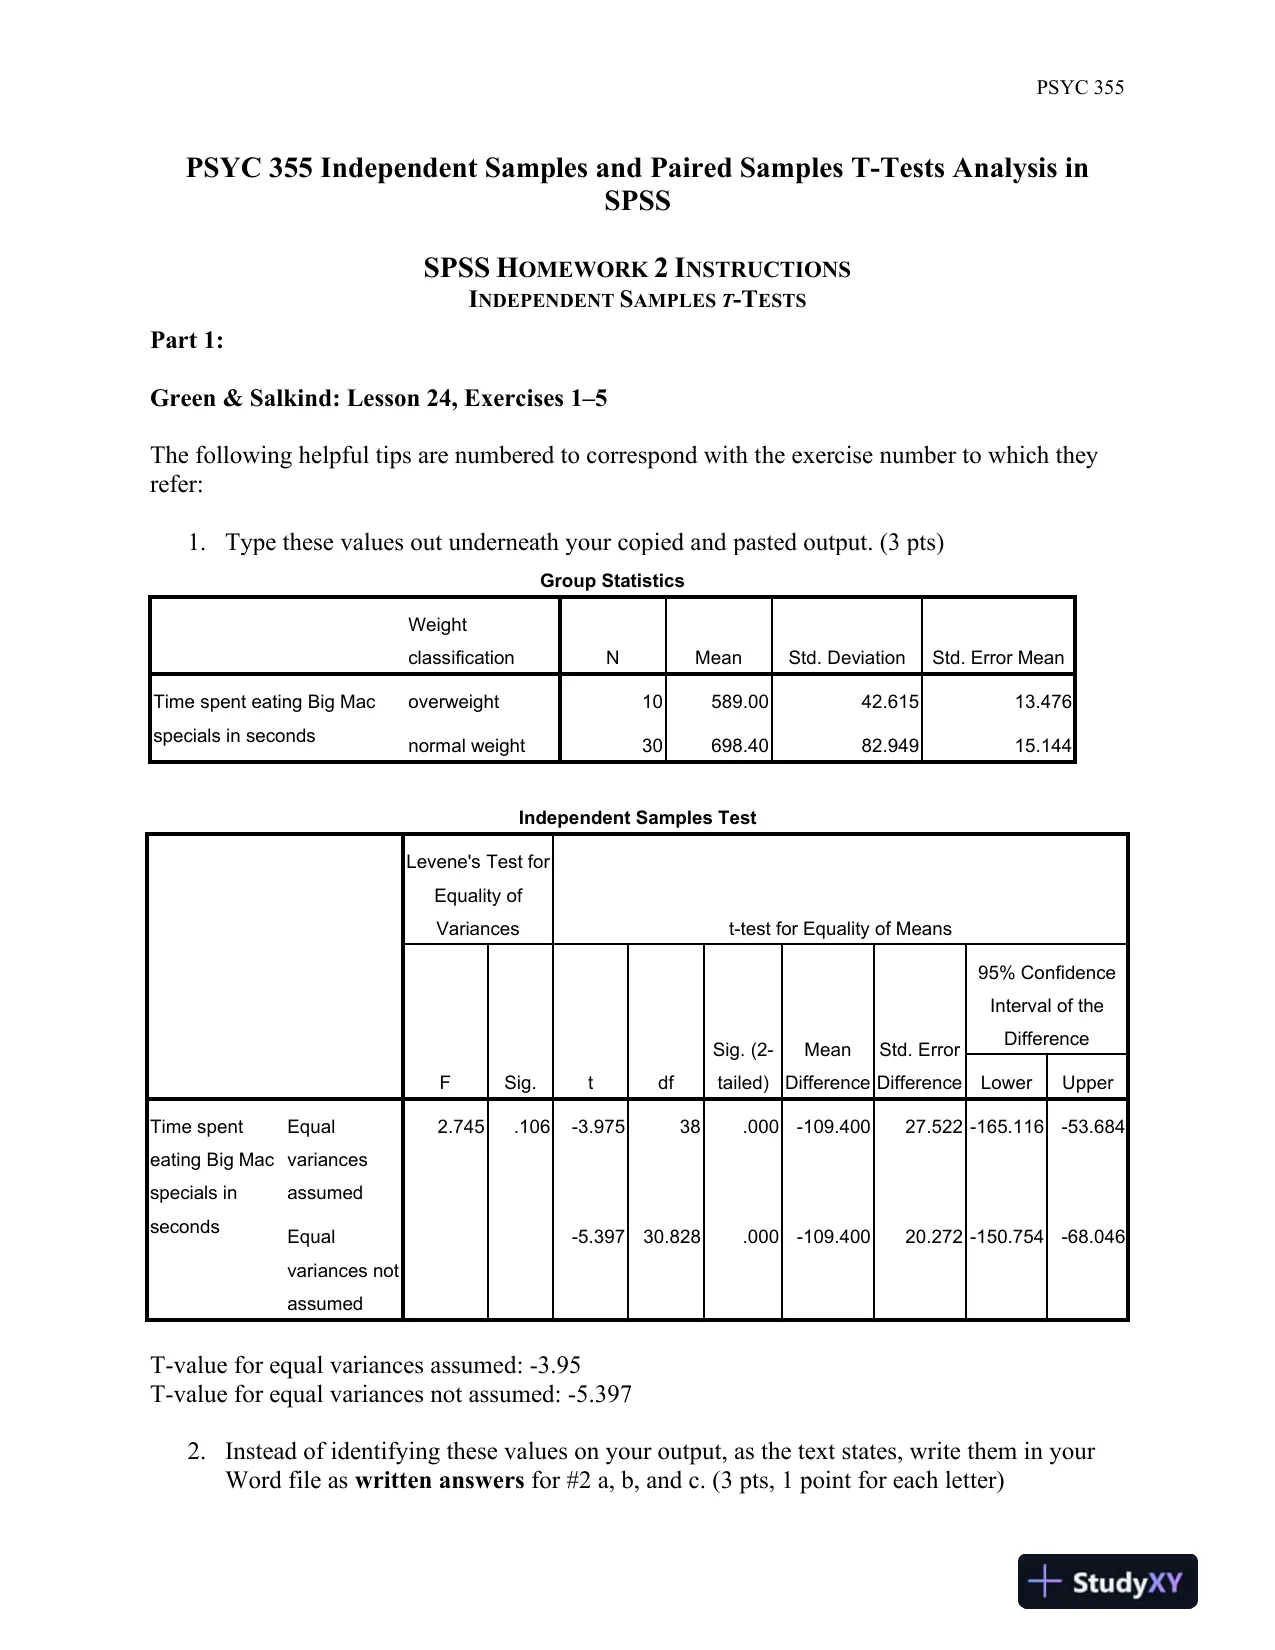
 PSYC 355Page1of7PSYC 355 Independent Samples and Paired Samples T-Tests Analysis inSPSSSPSSHOMEWORK2INSTRUCTIONSINDEPENDENTSAMPLEST-TESTSPart1:Green&Salkind:Lesson 24,Exercises 1–5The following helpful tips are numbered to correspond with theexercise number to which theyrefer:1.Type these values out underneath your copied and pasted output.(3pts)Group StatisticsWeightclassificationNMeanStd. DeviationStd. Error MeanTime spent eating Big Macspecials in secondsoverweight10589.0042.61513.476normal weight30698.4082.94915.144Independent Samples TestLevene's Test forEquality ofVariancest-test for Equality of MeansFSig.tdfSig. (2-tailed)MeanDifferenceStd. ErrorDifference95% ConfidenceInterval of theDifferenceLowerUpperTime spenteating Big Macspecials insecondsEqualvariancesassumed2.745.106-3.97538.000-109.40027.522-165.116-53.684Equalvariances notassumed-5.39730.828.000-109.40020.272-150.754-68.046T-value for equal variances assumed:-3.95T-value for equal variances not assumed:-5.3972.Instead of identifying these values on your output, as the text states, write them in yourWord file aswritten answersfor #2 a, b, and c.(3pts, 1 point for each letter)
Preview Mode
This document has 7 pages. Sign in to access the full document!