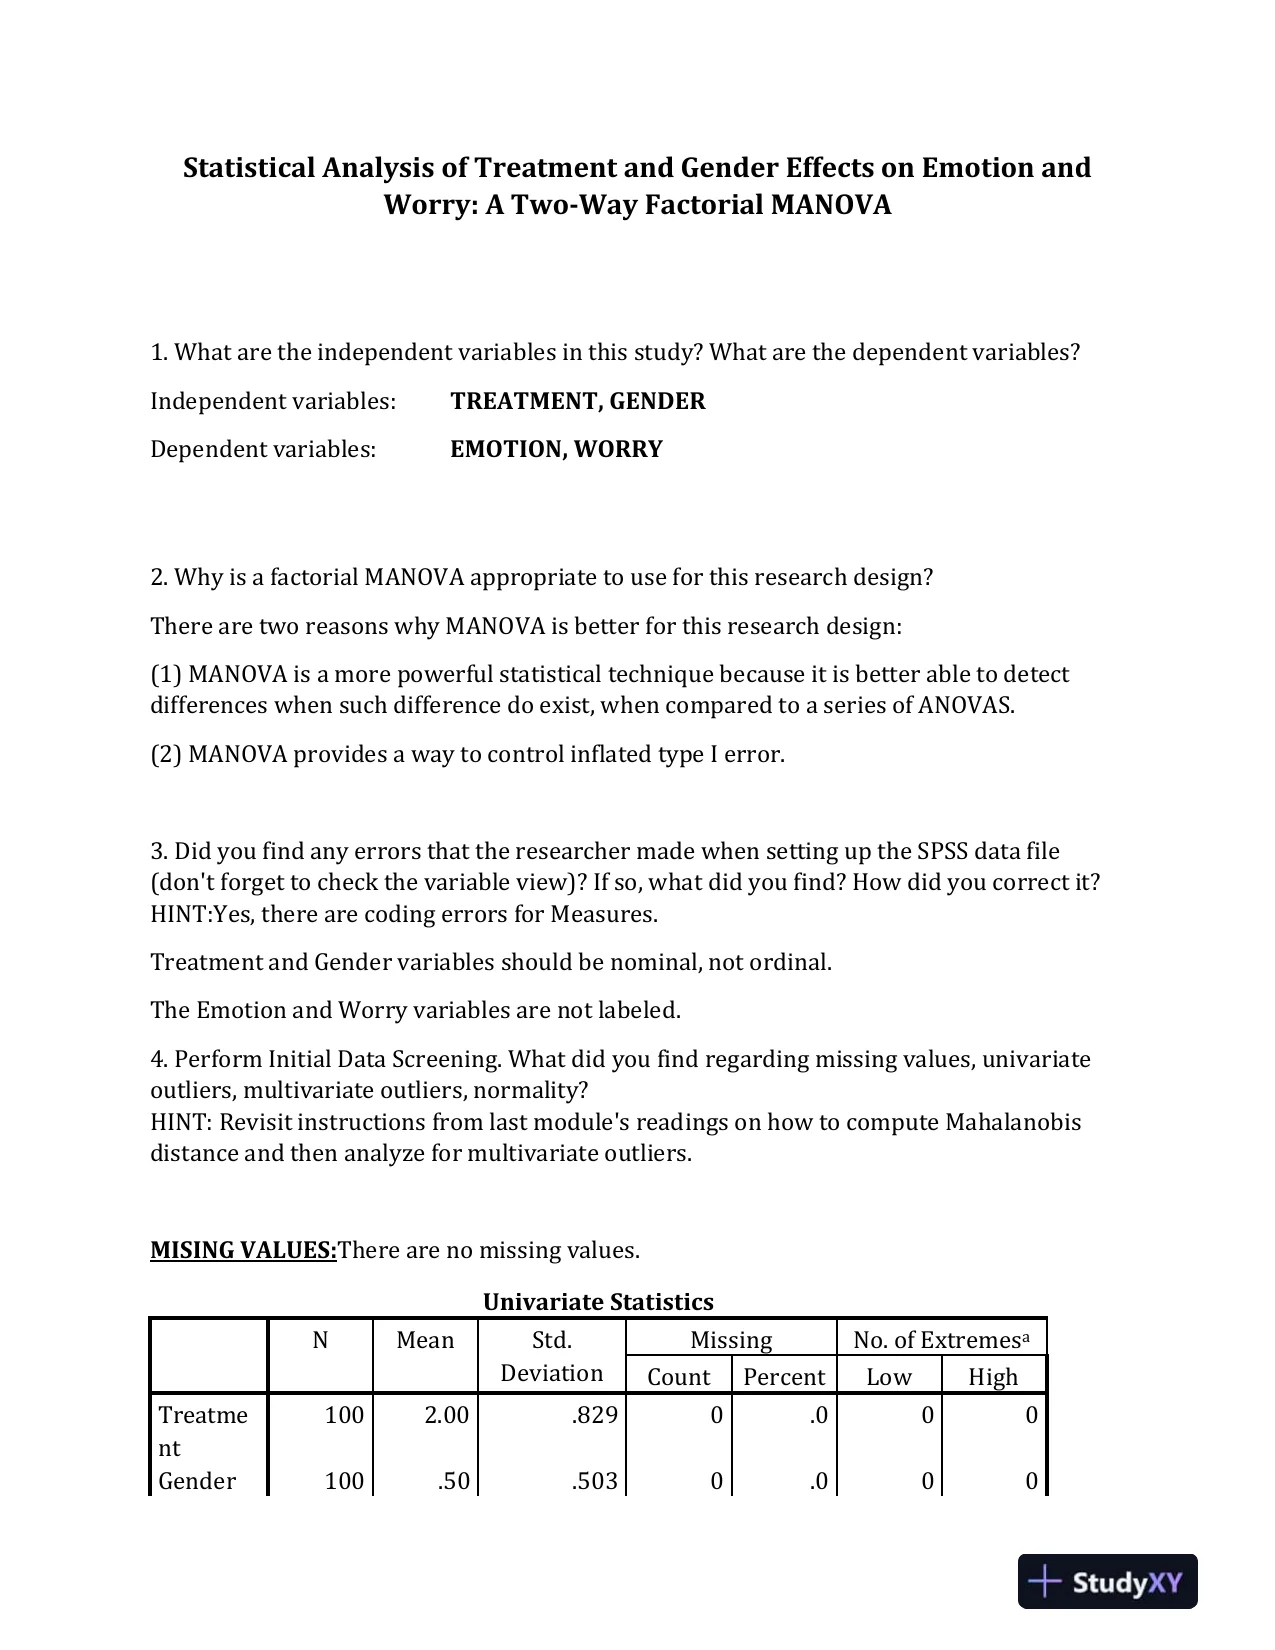
 Statistical Analysis of Treatment and Gender Effects on Emotion andWorry: A Two-Way Factorial MANOVA1. What are the independent variables in this study? What are the dependent variables?Independentvariables:TREATMENT, GENDERDependentvariables:EMOTION, WORRY2. Why is a factorial MANOVA appropriate to use for this research design?There are two reasons why MANOVA is better for this research design:(1) MANOVA is a more powerful statistical technique because it is better able to detectdifferences when such difference do exist, when compared to a series of ANOVAS.(2) MANOVA provides a way to control inflated type I error.3. Did you find any errors that the researcher made when setting up the SPSS data file(don't forget to check the variable view)? If so, what did you find? How did you correct it?HINT:Yes, there are coding errors for Measures.Treatment and Gender variables should be nominal, not ordinal.The Emotion and Worry variables are not labeled.4. Perform Initial DataScreening. What did you find regarding missing values, univariateoutliers, multivariate outliers, normality?HINT:Revisit instructions from last module's readings on how to compute Mahalanobisdistance and then analyze for multivariate outliers.MISING VALUES:There are no missing values.Univariate StatisticsNMeanStd.DeviationMissingNo. of ExtremesaCountPercentLowHighTreatment1002.00.8290.000Gender100.50.5030.000
Preview Mode
This document has 19 pages. Sign in to access the full document!