

Social Statistics for a Diverse Society Seventh Edition Solution Manual
- Statistics
- 88 pages
- Shared May 2025
Solve your textbook questions with ease using Social Statistics for a Diverse Society Seventh Edition Solution Manual, a comprehensive and easy-to-follow guide.
Preview 16 of 88 pages
See the first 16 pages exactly as they appear in the document.
Page 1 Read page 1 as text
Frankfort - Nachmias and Leon - Guerrero: Social Statisti cs for a Diverse Society, Seventh Edition Chapter 1 – Answers to All Exercises 1. Once our research question, the hypothesis, and the study variables have been selected, we move on to the next stage of the research process – measuring and collecting the data. The choice of a particular data collection method or instrument depends to our study objective. After our data have been collected, we have to find a systematic way to organize and analyze our data and set up some set of procedures to decide what we mean. 2. a. Females have less education than males; males retire at a greater age than females. b. Whites have greater incomes than any other race. Hispanics have incomes greater than blacks but less than whites. c. As the number of police in a city increases, the crime rate will decrease. d. Life satisfaction may vary with marital status, with satisfaction higher among married persons than those not married. e. As military expenditures as a percentage of GNP increase, the overall level of security may decrease, as witnessed by many Third World countries, or in the troubled Middle East. In fact, military expenditures (except during the Cold War) often increase because of rising conflict, but those expenditures may or may not guarantee more security. f. Minorities are more likely to care for their elderly parents than non - minorities. 3. a. Interval ratio b. Nominal c. Interval ratio d. Ordinal e. Nominal f. Interval ratio g. Interval ratio h. Nominal 4. a. Discrete c. Continuous f. Discrete g. Continuous 5. There are many possible variables from which to choose. Some of the most common selections by students will probably be: type of occupation or industry, work experience, and educational training or expertise. Students should first address the relationship between these variables and gender. For example, Men have more years of work experience than women in the same occupation. Student may also consider measuring structural bias or discrimination. 6. a. Unemployment records could be used to determine the actual number of unemployed; a descriptive statistic based upon the population. b. A survey is taken to estimate student opinions about the quality of food; inferential statistic. c. National health records can be used to determine the incidence rate of breast cancer among all Asian women, so this would be a descriptive statistic. d. The ratings will be gathered from a survey, so this is inferential.
Page 2 Page 3 Read page 3 as text
Frankfort - Nachmias and Leon - Guerrero: Social Statisti cs for a Diverse Society, Seventh Edition e. A university should be able to report GPA by major, so this is a descriptive statistic based upon the population. f. In theory, the U.S. records accurately all immigrants to this country. Therefore, the number of South East Asian immigrants would be a descriptive statistic. However , because of illegal immigration, surveys are also taken to estimate the total number of legal and unauthorized immigrants . In that event, the number of immigrants would be an inferential statistic. 7. In general, the difficulty with studying criminal acts is that the criminal act needs to be reported first. It is estimated that the majority of crimes are not reported to authorities. Data on reported crimes are routinely collected by the Federal Bureau of Investigation and the Bureau of Justice. 8. At the nominal level, a simple measure of political participation is whether or not someone voted in the most recent general election. This variable would be coded either “yes” or “no.” At the ordinal level, a composite measure could be constructed of both voting and political party membership, like this: Behavior Code Didn’t vote, no membership 0 Voted, no membership OR Membership, didn’t vote 1 Voted and membership 2 These codes are ordinal in scale because the amount of political participation can be ranked from high to low. Other possible ordinal variables can be constructed from other sets of behaviors, such as working in a candidate’s campaign, signing a petition, and so forth. The key points are to create a variable whose values can be ranked and whose values are not on an interval - ratio scale. At the interval - ratio level, political participation could be measured by the percentage of elections in which a person has voted since becoming eligible to vote, or the amount of money a person donated to political candidates during some specified time period. 9. Individual age: This variable could be measured as an interval - ratio variable, with actual age in years reported. As discussed in the chapter, interval ratio variables are the highest level of measurement and can also be measured at ordinal or nominal levels. Annual income: This variable could be measured as an interval - ratio variable, with actual dollar earnings reported. Religiosity: This variable could be measured in several ways. For example, as church attendance, the variable could be ordinal (number of times attended church in a month: every week, at least twice a month, less than two times a month, none at all). Student performance: This could be measured as an interval - ratio variable as GPA or test score. Social class: This variable is an ordinal variable, with categories low, working, middle and upper. Attitude toward gun control: This variable is an ordinal variable, with categories strongly disagree, disagree, neutral, agree and strongly agree. SPSS S olutions
Page 4 Read page 4 as text
Frankfort - Nachmias and Leon - Guerrero: Social Statistics for a Diverse Society, Seventh Edition Chapter 2 SPSS Solutions 1. a. 15.8% of the sample is divorced. b. 47.8% are married. c. Currently single includes those in the following response categories: widowed, divorced, and never married: 8.9 + 15.8 + 24.6 = 49.3% 2.
Page 5 Read page 5 as text
Frankfort - Nachmias and Leon - Guerrero: Social Statistics for a Diverse Society, Seventh Edition b. Each variable is an ordinal measurement. [Review the definitions of levels of measurement.] The higher value (5) indicates strong disagreement to the statement. Overall, respondents express positive attitudes toward immigrants. Most believe that immigrants are good for America (48.6% agree or strongly agree to the statement) and disagree that immigrants increase crime rates (46% disagree or strongly disagree). However, almost 41.7% agree or strongly agree that immigrants take away jobs. 3. a. RACIDIMP is an ordinal measure (a four point scale). b. RACIDIMP may vary by respondent’s racial identity (RACECEN1 and RACECEN2), whether the respondent lives in racially diverse neighborhood (RACLIVE) or the number of family generations in the household (FAMGEN). 4. Students are encouraged to determine on their own how to recode the variable. Students should consider how the years of education is related to degree attainment, for example: 12 years = high school graduate or 16 years = college graduate. 5. We recoded labor force participation rates into four categories: 1 – 25% and below, 2 – 25.01 - 50%, 3 – 50.01 - 75% and 4 – 75.01% and above. Our recoded variables are presented in the following tables. From the data we can conclude that labor participation is higher for males than females. There were no countries where the male labor force participation rate was 50% or less. Out of the 70 countries, all the
Page 6 Read page 6 as text
Frankfort - Nachmias and Leon - Guerrero: Social Statistics for a Diverse Society, Seventh Edition reported labor rate was 50.01% or higher. The largest category was 50.01 - 75 (75.7% of all cases). For women, the largest category was 50.01 - 75% (60% of all cases). Chapter 2 – Answers to Exercises 1. a. Race is a nominal variable. Class is an ordinal variable, since the categories can be ordered from lower to higher status. b. Frequency Table for Race Race Frequency (f) White 17 Nonwhite 13 Total (N) 30 Frequency Table for Class Class Frequency (f) Lower 3 Working 15 Middle 11 Upper 1 Total (N) 30 2. Class Percentage
Page 7 Read page 7 as text
Frankfort - Nachmias and Leon - Guerrero: Social Statistics for a Diverse Society, Seventh Edition Lower 10.0% Working 50.0% Middle 36.7% Upper 3.3% Total 100% a. The smallest perceived class is the upper class, composing only 3.3% of the survey. b. Together, the working and middle class compose 86.7% of the survey. 3. Number of traumas Frequency (f) 0 15 1 11 2 4 Total (N) 30 Trauma is an interval or ratio - level variable, since it has a real zero point and a meaningful numeric scale. b. People in this survey are more likely to have experienced no traumas last year (50% of the group). c. The proportion who experienced one or more traumas is calculated by first adding 36.7% and 13.3% = 50%. Then divide that number by 100 to obtain the proportion, 0.50, or half the group. 4. a. interval - ratio b.
Page 8 Read page 8 as text
Frankfort - Nachmias and Leon - Guerrero: Social Statistics for a Diverse Society, Seventh Edition c. 5.3% of the sample has 8 years of education or less, which corresponds to 41/775. d. Frequency Percent Cumulative Percent Less Than High School 135 17.4 17.4 High School Grad - no college 207 26.7 44.1 Some College 193 24.9 69.0 College Grad 240 31.0 100.0 Total 775 100.0 31% of the sample has graduated from college. 17.4% of the sample has not graduated from high school. This category includes all those with 11 years or less. 5. Ranking them from highest to lowest level of support: Strong Democrats, Strong Republicans and Independents. Support does vary by group, however, the majority of strong Democrats (56.8%) and strong Republicans (50%) agree/strongly agree with the statement. The group with the lowest level of support is Independents with 42.3%. 6.
Page 9 Read page 9 as text
Frankfort - Nachmias and Leon - Guerrero: Social Statistics for a Diverse Society, Seventh Edition Email hours per week Frequency Cf % C% 0 19 19 19 19 1 20 39 20 39 2 13 52 13 52 3 5 57 5 57 4 2 59 2 59 5 6 65 6 65 6 5 70 5 70 7 2 72 2 72 8 3 75 3 75 9 1 76 1 76 10 or more 23 99 23 99 Total 99 99% b. .57 5 (57/99) spent 3 hours or less on email per week. c. This group includes 5+2+3+1+23= 34 respondents. The proportion is 34/99 or .34 3 . 7. a. For whites. Education f % C% Less than high school 72 12.3 12.3 High school graduate 272 46.5 58.8 Junior college 46 7.9 66.7 Bachelor 118 20.2 86.9 Graduate 77 13.2 100.1 TOTAL 585 For blacks. Education f % C% Less than high school 26 22.0 22.0 High school graduate 59 50 72.0 Junior college 10 8.5 80.5 Bachelor 16 13.6 94.1 Graduate 7 5.9 100.0 TOTAL 118 For males.
Page 10 Read page 10 as text
Frankfort - Nachmias and Leon - Guerrero: Social Statistics for a Diverse Society, Seventh Edition Education f % C% Less than high school 46 14.0 14.0 High school graduate 151 45.9 59.9 Junior college 24 7.3 67.2 Bachelor 65 19.8 87 Graduate 43 13.1 100.1 TOTAL 329 For females. Education f % C% Less than high school 67 15.0 15.0 High school graduate 214 47.8 62.8 Junior college 37 8. 2 71. 0 Bachelor 81 18.1 89. 1 Graduate 49 10.9 100. 0 TOTAL 448 b. 40.2% of males attended school beyond high school. A l ower percentage of females (37.2 %) did the same. c. 58.8% for whites and 72.0% for blacks. d. Cumulative percentages are more similar for men and women than for white and blacks. Inequality appears to be larger between racial groups. A larger percentage of whites complete bachelor or graduate degrees than do blacks. 8. For both groups, the rate of infection can be ranked in the order presented. Rates are highest for blacks, followed by Hispanics and whites. Infection rates are higher for men than they are for women. The infection rate for black men is more than 2.5x the rate for black women. 9. a. Interval - ratio b. 33.7% of males and 34.9% of females had 3 children or more. c. Based on the cumulative percentages, a higher percentage of males have fewer children (0 - 1) than females (44.6% vs. 36.7%). Males (f) % C(%) Females (f) % C(%) 0 94 28.7 28.7 92 20.6 20.6 1 52 15.9 44.6 72 16.1 36.7
Page 11 Read page 11 as text
Frankfort - Nachmias and Leon - Guerrero: Social Statistics for a Diverse Society, Seventh Edition 2 71 21.7 66.3 127 28.4 65.1 3 47 14.4 80.7 91 20.4 85.5 4 30 9.2 89.9 38 8.5 94 5 or more 33 10.1 100 27 6.0 100 Total (N) 327 447 10. Pleas e note: the data is replicated in the exercise as it was reported by the Bureau of Justice Statistic s. Percentages do not equal 100. All Males (%) C(%) All Females (%) C(%) 18 - 19 1.5 1.5 .9 .9 20 - 24 12.4 13.9 11.2 12.1 25 - 29 16.3 30.2 17.4 29.5 30 - 34 16.5 46.7 17.5 47 35 - 39 13.7 60.4 14.8 61.8 40 - 44 12.5 72.9 14.1 75.9 45 - 49 11.0 83.9 11.8 87.7 50 - 54 7.7 91.6 7.0 94.7 55 - 59 4.2 95.8 3.2 97. 9 60 - 64 2.2 98 1.4 99.3 65+ 1.8 99.8 .9 100.2 11. a. Victimization rates are highest for those 12 - 17 years of age. b. Victimization rates have been declining since 1994 - 1998. In the last time period, 2005 - 2010, all rates are below 5 per 1,000 females. Across the three time periods, victimization rates are highest for females age 12 - 17 (11.3 to 4.1). Second high est rates are among females age 18 - 34 year (7.0 to 3.7). 12. For sex and age: Women were more likely than men to indicate that same - sex marriage should be legal. There was an increase in both age groups for men and women. The highest increase was among men ages 18 - 49 years. For age: There is an increase in support across all three age groups. The largest increase was among those 18 - 34 years of age (70 - 54 = 16%). For political affiliation: There was an increase in the percent indicating support for the legalization of same - sex marriage among Democrats and Independents. No change among Republicans. For political views: There was an increase in support for same - sex m arriage among all political affiliation categories. The percent increases can be ranked from high to low: moderates (9%), liber als (8%) and conservatives (3%). 13. a. SEX: nominal RACE: nominal AGE: ordinal EDUCATION: ordinal INCOME LEVEL: ordinal RELIGIOUS AFFILIATION: nominal b. Based on the Gallup data, we know that the majority of female voters, total nonwhite and non - Hispanic black voters, young (18 - 29) voters, voters with post graduate degrees and lower income voters
Page 12 Read page 12 as text
Frankfort - Nachmias and Leon - Guerrero: Social Statistics for a Diverse Society, Seventh Edition supported President Obama and Vice President Biden . Governor Romney and Senator Ryan had strongest support among men, non - Hispanic white s , seniors (65 years and older), college graduates or those with some college, and voters who earned $36,000 or more. 14. Native born individuals are more likely to be educated than foreign born. Fifty nine percent of the native born has some college or higher (28% had a bachelor’s degre e or higher). In comparison, 46% foreign born has some college or higher (27% percent had a bachelor’s degree or higher).
Page 13 Read page 13 as text
Frankfort - Nachmias and Leon - Guerrero: Social Statistics for a Diverse Society, Seventh Edition Chapter 3 SPSS Solutions 1. a. Bar graph for AGEGRPA b. Bar graphs for males and females (% of cases reported)
Page 14 Read page 14 as text
c. Overall, almost two third of the respondents are above 45. The largest age category for both male and female respondents is the oldest group, 45+. A slightly higher percent of males are 45 or older (74.91%) than the females (65.7%). The second largest age group is the youngest one, 18 - 34. 17.38% of the female respondents fall in this category as compared to their male counterparts of whom 12.37% are between 18 to 34 years of age. 2.
Page 15 Read page 15 as text
The amount of respondents who have ever looked for information about health or medical topics from any source increases as educational degree increases, from 44.4% among those with less than 8 years of education to 93.1% among those with a postgraduate degree. You can see the increase in this category by tracking how the blue section of the pie chart increases in size with each educational level. 3. a. GeneralHealth (Bar Chart). Approximately the same percent of men and women report excellent, very good and good health. A slightly higher percentage of males report fair health (13.1 vs. 11.9%) than women and slightly more women report poor health (3.4 vs. 2.9%) than women.
Page 16 Read page 16 as text
b. Occupation Status (Bar Chart) . A higher percentage of males are employed than females (57.12% vs. 51.73% The largest difference between the two groups is in the “Homemaker” category in which 10.61% of the female respondents fall as compared to only 0.178% of their male counterparts. c. EverHadCancer (Pie Chart) . A slightly higher percentage of men reported that they have been diagnosed as having cancer than women, 14.8% vs. 13.9%
72 more pages in the full document
Unlock it once and it stays in your library, ready to chat with or turn into flashcards.
Unlock the full documentMore Statistics study materials
See all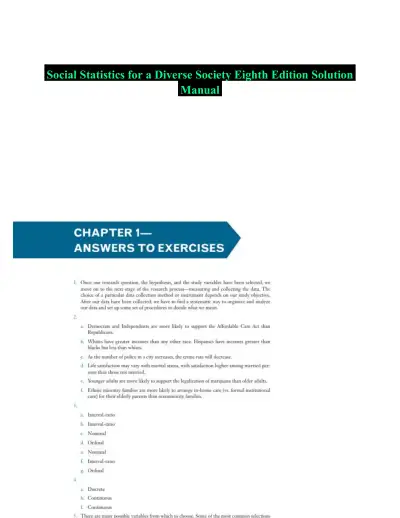 Textbook Guides
Social Statistics for a Diverse Society Eighth Edition Solution Manual
Statistics
93 pagesMay 2025 Exam Guides
Test Bank for Biostatistics for the Biological and Health Sciences , 2nd Edition
Statistics
182 pages161downloadsFeb 2025 Exam Guides
Elementary Statistics, 13th Edition Test Bank
Statistics
239 pages160downloadsFeb 2025 Textbook Guides
Solution Manual For Statistics for Managers Using Microsoft Excel, 7th Edition
Statistics
1418 pages158downloadsFeb 2025 Textbook Guides
Statistics for Managers Using Microsoft Excel 8th Edition Solution Manual
Statistics
1343 pages156downloadsFeb 2025 Textbook Guides
Essentials of Social Statistics for a Diverse Society Second Edition Solution Manual
Statistics
137 pages135downloadsFeb 2025 Exam Guides
Test Bank For Elementary Statistics, 3rd Edition
Statistics
969 pages126downloadsFeb 2025 Textbook Guides
Solution Manual for Business Statistics, 4th Edition
Statistics
582 pages125downloadsFeb 2025
Study this document with CramX
Once it is in your library, every tool can work from it.