

Test Bank for Business Statistics, 4th Edition
- Statistics
- 714 pages
- Shared May 2025
Achieve exam success with Test Bank for Business Statistics, 4th Edition, which provides the key questions and solutions for your exam.
Preview 16 of 714 pages
See the first 16 pages exactly as they appear in the document.
Page 1 Read page 1 as text
1-1 Chapter 1: Data and Decisions– Quiz A Name_________________________ 1.4 Data Sources: Where, How, and When 1. Viamedia, the cable industry's leading independent cable rep firm and provider of online advertising services, sponsored an online survey in June, 2013 to understand television viewing habits. The survey was given to 2,029 American adults age 18 and older, of whom 1,958 watch television programming. Of interest was how Americans watched television –72% watch cable TV while 33% watch on a device (tablet, smartphone, computer). Describe the W’s for the information given. Who: What: When: Where: How: Why: 1.3 Variable Types. 2. The following tables display some of the demographic data collected in a recent (2012) Nielsen Global Survey analyzing Asian American purchasing behaviors and television viewing patterns. List the variables in the data set. Indicate whether each variable is categorical or quantitative. If the variable is quantitative, give the units. Income Ranges % Total U.S. Households % Asian- American Households Age Distribution % Total U.S. Households % Asian- American Households < $25,000 24% 20% 0–9 13% 12% $25,000– $34,999 11% 8% 10–17 11% 10% $35,000– $49,999 16% 13% 18–24 10% 10% $50,000– $74,999 20% 18% 25–34 13% 16% $75,000– $99,999 12% 14% 45–54 14% 14% $100,000+ 18% 29% 55–74 20% 14% 75+ 6% 04% Composition of Asian-Americans % Composition Asian-Indian 19% Vietnamese 11% Chinese 23% Korean 10% Filipino 17% Japanese 5% Other Asian 15%
Page 2 Page 3 Read page 3 as text
1-2 Chapter 1 Data and Decisions 1.3 Variable Types. 3. In addition to the variables listed above, data were also collected on the variables listed below. Indicate whether each is nominal or ordinal. Region of U.S. (NE, NW, MW, SW, SE) Education (Less than High School, High School, Some College, College +) Marital Status (Single, Widowed, Divorced, Married) 1.3 Variable Types. 4. For each of the following, indicate whether the data are cross-sectional or time series: Monthly spending on household goods Change in population for 5 consecutive years Percentage of adults who bank online Composition of types of Asian American families in the most populated U.S. cities. Monthly demand for a technology item Percentage of adults who purchase goods online
Page 4 Read page 4 as text
Quiz A 1-3 Chapter 1: Data and Decisions – Quiz A – Key 1. Viamedia, the cable industry's leading independent cable rep firm and provider of online advertising services, sponsored an online survey in June, 2013 to understand television viewing habits. The survey was given to 2,029 American adults age 18 and older, of whom 1,958 watch television programming. Of interest was how Americans watched television –72% watch cable TV while 33% watch on a device (tablet, smartphone, computer). Describe the W’s for the information given. Who: American adults aged 18 and older What: Television viewing When: June 2013 Where: United States How: Online survey Why: to analyze how Americans watch television
Page 5 Read page 5 as text
1-4 Chapter 1 Data and Decisions 2. The following tables display some of the demographic data collected in a recent (2012) Nielsen Global Survey analyzing Asian American purchasing behaviors and television viewing patterns. List the variables in the data set. Indicate whether each variable is categorical or quantitative. If the variable is quantitative, give the units. Household Income Ranges % Total U.S. Households % Asian- American Households Age Distribution % Total U.S. Households % Asian- American Households < $25,000 24% 20% 0–9 13% 12% $25,000– $34,999 11% 8% 10–17 11% 10% $35,000– $49,999 16% 13% 18–24 10% 10% $50,000– $74,999 20% 18% 25–34 13% 16% $75,000– $99,999 12% 14% 45–54 14% 14% $100,000+ 18% 29% 55–74 20% 14% 75+ 6% 04% Types of Expenditure Asian-Americans Total U.S. Market Housing $20,800 $16,900 Transportation $10,100 $9,000 Food $8,000 $6,600 Personal Insurance and Food $7,800 $5,600 Apparel $2,400 $1,700 Categorical: Household Income Ranges, Age Distribution, Types of Expenditure Quantitative: % Total Household, % Asian-American Households, % Age Distribution- Total U.S. and Asian-American, Expenditures of Asian-Americans ($), Expenditures of Total U.S. Market ($)
Page 6 Read page 6 as text
Quiz A 1-5 3. In addition to the variables listed above, data were also collected on the variables listed below. Indicate whether each is nominal or ordinal. Region (NE, NW, MW, SW, SE) Nominal Education (Less than High School, High School, Some College, College +) Ordinal Marital Status (Single, Widowed, Divorced, Married) Nominal 4. For each of the following, indicate whether the data are cross-sectional or time series: Monthly spending on household goods Time Series Change in population for 5 consecutive years Time Series Composition of types of Asian American families in the most populated U.S. cities. Cross-Sectional Monthly demand for a technology item Time Series Percentage of adults who purchase goods online Cross-Sectional
Page 7 Read page 7 as text
1-6 Chapter 1 Data and Decisions Chapter 1: Data and Decisions – Quiz B Name_________________________ 1.4 Data Sources: Where, How, and When. 1. Consumer Reports Health routinely compares drugs in terms of effectiveness and safety. In summer 2008 they reviewed drugs used to treat arthritis. Information was reported on convenience of use (how many pills required each day), possible side effects (e.g., dizziness, stomach upset), cost, and ratings of effectiveness in relieving symptoms (very effective, somewhat effective, not effective). Describe the W’s for the information given. Who: What: When: Where: How: Why: 1.3 Variable Types. 2. List the variables reported in the Consumer Reports Health article on drugs used to treat arthritis. If the variable is quantitative, give the units. If the variable is categorical, indicate whether it is nominal or ordinal. 1.3 Variable Types. 3. The Human Resources Department of a large corporation maintains records on its employees. The table displays some of these data. List the variables in the data set. Indicate whether each variable is categorical or quantitative. If the variable is quantitative, give the units. If the variable is categorical, indicate whether it is nominal or ordinal. Age Employment Category Education Participates in Wellness Program? Paycheck Benefit Deductions 32 Clerical High School Yes $250 52 Professional College No $120 60 Professional Junior College Yes $0 28 Clerical High School No $120 1.3 Variable Types. 4. For each of the following, indicate whether the data are cross-sectional or time series: Company quarterly profits Percentage of American adults who work full time Historical closing stock prices
Page 8 Read page 8 as text
Quiz B 1-7 Chapter 1: Data and Decisions – Quiz B – Key 1. Consumer Reports Health routinely compares drugs in terms of effectiveness and safety. In summer 2008 they reviewed drugs used to treat arthritis. Information was reported on convenience of use (how many pills required each day), possible side effects (e.g., dizziness, stomach upset), cost, and ratings of effectiveness in relieving symptoms (very effective, somewhat effective, not effective). Describe the W’s for the information given. Who: drugs to treat arthritis currently on the market What: convenience of use, side effects, cost, effectiveness ratings When: summer 2008 Where: not specified, probably United States How: testing on drugs Why: information for potential consumers/patients 2. List the variables reported in the Consumer Reports Health article on drugs used to treat arthritis. If the variable is quantitative, give the units. If the variable is categorical, indicate whether it is nominal or ordinal. Categorical: Side effect (nominal), effectiveness rating (ordinal) Quantitative: Convenience of use (number of pills), Cost ($) 3. The Human Resources Department of a large corporation maintains records on its employees. The table displays some of these data. List the variables in the data set. Indicate whether each variable is categorical or quantitative. If the variable is quantitative, give the units. If the variable is categorical, indicate whether it is nominal or ordinal.
Page 9 Read page 9 as text
1-8 Chapter 1 Data and Decisions Age Employment Category Education Participates in Wellness Program? Paycheck Benefit Deductions 32 Clerical High School Yes $250 52 Professional College No $120 60 Professional Junior College Yes $0 28 Clerical High School No $120 Categorical: Employment Category (nominal), Education (ordinal), Participation in Wellness Program? (nominal) Quantitative: Age (years), Paycheck Benefit Deductions ($) 4. For each of the following, indicate whether the data are cross-sectional or time series: Company quarterly profits Time Series Percentage of American adults who work full time Cross-Sectional Historical closing stock prices Time Series
Page 10 Read page 10 as text
Quiz C 1-9 Chapter 1: Data and Decisions – Quiz C Name_________________________ 1.4 Data Sources: Where, How, and When. 1. Consumer Reports National Research Center routinely compares products and services. A poll of more than 1,800 U.S. residents was conducted shortly after the 2008 holiday season. What they found was that fewer people than in the previous year tipped their service providers (newspaper carrier, barber, mail carrier, hairdresser, garbage collector) or the amount that consumers tip for specific services was reduced.. Information was reported on the type of service, whether a tip or gift was given, and the median total value of the tip. Describe the W’s for the information given. Who: What: When: Where: How: Why: 1.3 Variable Types. 2. List the variables reported in the Consumer Reports Magazine article on tipping. If the variable is quantitative, give the units. If the variable is categorical, indicate whether it is nominal or ordinal. 1.3 Variable Types. 3. Businesses in a U.S. city were surveyed about information to provide to prospective employees after graduating from business school. The table displays some of these data. List the variables in the data set. Indicate whether each variable is categorical or quantitative. If the variable is quantitative, give the units. If the variable is categorical, indicate whether it is nominal or ordinal. Employment Category Require an MBA Degree? Prefer Graduates with Work Experience? Median Salary of New Graduates Sales No No $35,000 Management Yes Yes $47,000 Accounting No Yes $52,000 Advertising No No $45,000 1.3 Variable Types. 4. For each of the following, indicate whether the data are cross-sectional or time series: Dow Jones Index Eating habits by age group Attitudes toward abortion over past 10 years Voting behavior data for a particular neighborhood
Page 11 Read page 11 as text
1-10 Chapter 1 Data and Decisions Chapter 1: Data and Decisions – Quiz C – Key 1. Consumer Reports National Research Center routinely compares products and services. A poll of more than 1,800 U.S. residents was conducted shortly after the 2008 holiday season. What they found was that fewer people tipped their service providers (newspaper carrier, barber, mail carrier, hairdresser, garbage collector) than in the previous year or the amount that consumers tip for specific services was reduced. Information was reported on the type of service, whether a tip or gift was given, the level of tipping, and the median total value of the tip. Describe the W’s for the information given. Who: U.S. residents, most likely adults although not specified What: Amount of tipping and type of tipping for service providers during the holiday season for this year and the previous year When: shortly after the holiday season 2008 Where: United States How: A poll – not specified what type Why: investigate consumer behavior in tipping service providers 2. List the variables reported in the Consumer Reports Magazine article on tipping. If the variable is quantitative, give the units. If the variable is categorical, indicate whether it is nominal or ordinal. Categorical: Whether or not someone tipped this year and/or previous year (nominal), type of tipping–gift or money (nominal), service provider who was tipped (nominal), level of tipping–low, medium, high (ordinal) Quantitative: Median value of tip ($),
Page 12 Read page 12 as text
Quiz C 1-11 3. Businesses in a U.S. city were surveyed about information to provide to prospective employees after graduating from business school. The table displays some of these data. List the variables in the data set. Indicate whether each variable is categorical or quantitative. If the variable is quantitative, give the units. If the variable is categorical, indicate whether it is nominal or ordinal. Employment Category Require an MBA Degree? Level of Work Experience Preferred? Median Salary of New Graduates Sales No None $35,000 Management Yes Extensive $47,000 Accounting No Moderate $52,000 Advertising No None $45,000 Categorical: Employment Category (nominal), Require an MBA Degree? (nominal), Level of Work Experience Preferred? (ordinal) Quantitative: Median Salary of New Graduates ($) 4. For each of the following, indicate whether the data are cross-sectional or time series: Dow Jones Index Time Series Eating habits by age group Cross-Sectional Attitudes toward abortion over past 10 years Time Series Voting behavior data for a particular neighborhood Cross-Sectional
Page 13 Read page 13 as text
1-12 Chapter 1 Data and Decisions Chapter 1: Data and Decisions – Quiz D – Multiple Choice Name________________________ 1.4 Data Sources: Where, How, and When. 1. In the fall of 2007, the Pew Internet & Life Project conducted telephone interviews with a sample of American adults aged 18 and older about online shopping. American adults aged 18 and older constitute the ______ of the study. A. Who B. What C. When D. Where E. How 1.3 Variable Types. 2. A few of the variables for which data were collected in the Pew Internet & Life Project study about online shopping include age, gender, income, and number of hours spent shopping online per month. Which of the variables is categorical? A. Age B. Gender C. Income D. Number of hours spent shopping online E. None 1.3 Variable Types. 3. The Pew Internet & Life Project study about online shopping asked respondents to indicate their education level on the following scale: Less than High School, High School, Some College, College +. Which of the following statements is (are) true? A. Education level is a categorical variable. B. Education level is nominal scaled. C. Education level is ordinal scaled. D. Both A and B E. Both A and C
Page 14 Read page 14 as text
Quiz D 1-13 1.4 Data Sources: Where, How, and When. 4. Consumer Reports Health routinely compares drugs in terms of effectiveness and safety. In summer 2008 they reviewed drugs used to treat arthritis. Among the information reported was convenience of use (how many pills required each day) and possible side effects (e.g., dizziness, stomach upset). Convenience of use and possible side effects constitute the ________ of the study. A. Who B. What C. When D. Where E. How 1.4 Data Sources: Where, How, and When. 5. What is the “Who” in a Consumer Reports Health study on the effectiveness and safety of drugs used to treat arthritis? A. drugs to treat arthritis currently on the market B. convenience of use and possible side effects C. summer 2008 D. the United States E. testing on drugs 1.3 Variable Types. 6. A Consumer Reports Health study on the effectiveness and safety of arthritis drugs collected data on possible side effects. This is what kind of variable? A. Quantitative B. Categorical C. Nominal D. Both A and C E. Both B and C 1.3 Variable Types. 7. A Consumer Reports Health study on arthritis drugs takes into consideration cost. Cost _____________________________________ . A. is a nominal variable B. is a categorical variable C. is a quantitative variable D. is an ordinal variable E. is an irrelevant variable
Page 15 Read page 15 as text
1-14 Chapter 1 Data and Decisions 1.3 Variable Types. 8. The Human Resources Department of a large corporation maintains records on its employees. Data are maintained of the following variables: Age, Employment Category, Education, Whether or not the employee participates in a wellness program, and Paycheck benefit deductions. Which of these variables are categorical? A. Age, Employment Category , and Education B. Employment Category, Education , and Whether or not the employee participates in a wellness program C. Education, Whether or not the employee participates in a wellness program , and Paycheck benefit deductions D. All of the variables E. None of the variables 1.3 Variable Types. 9. Which of the following is (are) based on cross sectional data? A. Company quarterly profits B. Percentage of American adults who work full time C. Historical closing stock prices D. All of the above E. None of the above. 1.3 Variable Types. 10. Which of the following is (are) time series data? A. Weekly receipts at a clothing boutique B. Monthly demand for an automotive part C. Quarterly sales of automobiles D. All of the above E. None of the above
Page 16 Read page 16 as text
Quiz D 1-15 Chapter 1: Data and Decisions – Quiz D – Key 1. A 2. B 3. E 4. B 5. A 6. E 7. C 8. B 9. B 10. D
698 more pages in the full document
Unlock it once and it stays in your library, ready to chat with or turn into flashcards.
Unlock the full documentMore Statistics study materials
See all Textbook Guides
Solution Manual for Business Statistics, 4th Edition
Statistics
582 pages125downloadsFeb 2025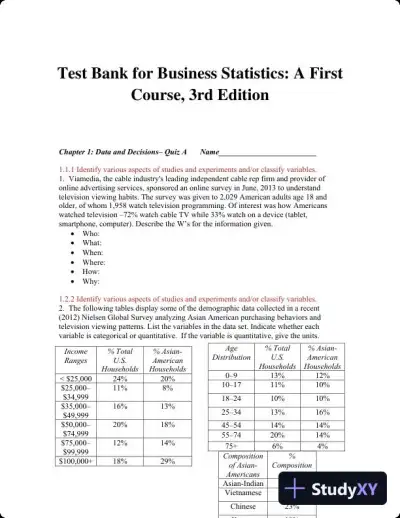 Exam Guides
Test Bank for Business Statistics: A First Course, 3rd Edition
Statistics
436 pages94downloadsFeb 2025 Textbook Guides
Solution Manual for Business Statistics: A First Course, 3rd Edition
Statistics
348 pagesMay 2025 Exam Guides
Test Bank for Biostatistics for the Biological and Health Sciences , 2nd Edition
Statistics
182 pages161downloadsFeb 2025 Exam Guides
Elementary Statistics, 13th Edition Test Bank
Statistics
239 pages160downloadsFeb 2025 Textbook Guides
Solution Manual For Statistics for Managers Using Microsoft Excel, 7th Edition
Statistics
1418 pages158downloadsFeb 2025 Textbook Guides
Statistics for Managers Using Microsoft Excel 8th Edition Solution Manual
Statistics
1343 pages156downloadsFeb 2025 Textbook Guides
Essentials of Social Statistics for a Diverse Society Second Edition Solution Manual
Statistics
137 pages135downloadsFeb 2025
Study this document with CramX
Once it is in your library, every tool can work from it.