

Test Bank for Business Statistics: A First Course, 3rd Edition
- Statistics
- 436 pages
- Shared February 2025
- 94 downloads
Test Bank for Business Statistics: A First Course, 3rd Edition helps you familiarize yourself with exam formats and key concepts.
Preview 31 of 436 pages
See the first 31 pages exactly as they appear in the document.
Page 1 Read page 1 as text
1-1 Chapter 1: Data and Decisions– Quiz A Name_________________________ 1.1.1 Identify various aspects of studies and experiments and/or classify variables. 1. Viamedia, the cable industry's leading independent cable rep firm and provider of online advertising services, sponsored an online survey in June, 2013 to understand television viewing habits. The survey was given to 2,029 American adults age 18 and older, of whom 1,958 watch television programming. Of interest was how Americans watched television –72% watch cable TV while 33% watch on a device (tablet, smartphone, computer). Describe the W’s for the information given. • Who: • What: • When: • Where: • How: • Why: 1.2.2 Identify various aspects of studies and experiments and/or classify variables. 2. The following tables display some of the demographic data collected in a recent (2012) Nielsen Global Survey analyzing Asian American purchasing behaviors and television viewing patterns. List the variables in the data set. Indicate whether each variable is categorical or quantitative. If the variable is quantitative, give the units. Age Distribution % Total U.S. Households % Asian- American Households 0–9 13% 12% 10–17 11% 10% 18–24 10% 10% 25–34 13% 16% 45–54 14% 14% 55–74 20% 14% 75+ 6% 4% Income Ranges % Total U.S. Households % Asian- American Households < $25,000 24% 20% $25,000– $34,999 11% 8% $35,000– $49,999 16% 13% $50,000– $74,999 20% 18% $75,000– $99,999 12% 14% $100,000+ 18% 29% Composition of Asian- Americans % Composition Asian-Indian 19% Vietnamese 11% Chinese 23% Korean 10% Filipino 17% Japanese 5% Other Asian 15%
Page 2 Page 3 Read page 3 as text
1-2 Chapter 1 Data and Decisions 1.2.1 Identify various aspects of studies and experiments and/or classify variables. 3. In addition to the variables listed above, data were also collected on the variables listed below. Indicate whether each is nominal or ordinal. • Region of U.S. (NE, NW, MW, SW, SE) • Education (Less than High School, High School, Some College, College +) • Marital Status (Single, Widowed, Divorced, Married) 1.2.3 Identify various aspects of studies and experiments and/or classify variables. 4. For each of the following, indicate whether the data are cross-sectional or time series: • Monthly spending on household goods • Change in population for 5 consecutive years • Percentage of adults who bank online • Composition of types of Asian American families in the most populated U.S. cities. • Monthly demand for a technology item • Percentage of adults who purchase goods online
Page 4 Read page 4 as text
Quiz A 1-3 Chapter 1: Data and Decisions – Quiz A – Key 1. Viamedia, the cable industry's leading independent cable rep firm and provider of online advertising services, sponsored an online survey in June, 2013 to understand television viewing habits. The survey was given to 2,029 American adults age 18 and older, of whom 1,958 watch television programming. Of interest was how Americans watched television –72% watch cable TV while 33% watch on a device (tablet, smartphone, computer). Describe the W’s for the information given. • Who: American adults aged 18 and older • What: Television viewing • When: June 2013 • Where: United States • How: Online survey • Why: to analyze how Americans watch television
Page 5 Read page 5 as text
1-4 Chapter 1 Data and Decisions 2. The following tables display some of the demographic data collected in a recent (2012) Nielsen Global Survey analyzing Asian American purchasing behaviors and television viewing patterns. List the variables in the data set. Indicate whether each variable is categorical or quantitative. If the variable is quantitative, give the units. Categorical: Household Income Ranges, Age Distribution, Types of Expenditure Quantitative: % Total Household, % Asian-American Households, % Age Distribution- Total U.S. and Asian-American, Expenditures of Asian-Americans ($),Expenditures of Total U.S. Market ($) Age Distribution % Total U.S. Households % Asian- American Households 0–9 13% 12% 10–17 11% 10% 18–24 10% 10% 25–34 13% 16% 45–54 14% 14% 55–74 20% 14% 75+ 6% 4% Household Income Ranges % Total U.S. Households % Asian- American Households < $25,000 24% 20% $25,000– $34,999 11% 8% $35,000– $49,999 16% 13% $50,000– $74,999 20% 18% $75,000– $99,999 12% 14% $100,000+ 18% 29% Types of Expenditure Asian- Americans Total U.S. Market Housing $20,800 $16,900 Transportation $10,100 $9,000 Food $8,000 $6,600 Personal Insurance and Food $7,800 $5,600 Apparel $2,400 $1,700
Page 6 Read page 6 as text
Quiz A 1-5 3. In addition to the variables listed above, data were also collected on the variables listed below. Indicate whether each is nominal or ordinal. • Region (NE, NW, MW, SW, SE) Nominal • Education (Less than High School, High School, Some College, College +) Ordinal • Marital Status (Single, Widowed, Divorced, Married) Nominal 4. For each of the following, indicate whether the data are cross-sectional or time series: • Monthly spending on household goods Time Series • Change in population for 5 consecutive years Time Series • Composition of types of Asian American families in the most populated U.S. cities. Cross-Sectional • Monthly demand for a technology item Time Series • Percentage of adults who purchase goods online Cross-Sectional
Page 7 Read page 7 as text
1-6 Chapter 1 Data and Decisions Chapter 1: Data and Decisions – Quiz B Name_________________________ 1.1.1 Identify various aspects of studies and experiments and/or classify variables. 1. Consumer Reports Health routinely compares drugs in terms of effectiveness and safety. In summer 2008 they reviewed drugs used to treat arthritis. Information was reported on convenience of use (how many pills required each day), possible side effects (e.g., dizziness, stomach upset), cost, and ratings of effectiveness in relieving symptoms (very effective, somewhat effective, not effective). Describe the W’s for the information given. • Who: • What: • When: • Where: • How: • Why: 1.2.1 Identify various aspects of studies and experiments and/or classify variables. 2. List the variables reported in the Consumer Reports Health article on drugs used to treat arthritis. If the variable is quantitative, give the units. If the variable is categorical, indicate whether it is nominal or ordinal. 1.2.2 Identify various aspects of studies and experiments and/or classify variables. 3. The Human Resources Department of a large corporation maintains records on its employees. The table displays some of these data. List the variables in the data set. Indicate whether each variable is categorical or quantitative. If the variable is quantitative, give the units. If the variable is categorical, indicate whether it is nominal or ordinal. Age Employment Category Education Participates in Wellness Program? Paycheck Benefit Deductions 32 Clerical High School Yes $250 52 Professional College No $120 60 Professional Junior College Yes $0 28 Clerical High School No $120 1.2.3 Identify various aspects of studies and experiments and/or classify variables. 4. For each of the following, indicate whether the data are cross-sectional or time series: • Company quarterly profits • Percentage of American adults who work full time • Historical closing stock prices
Page 8 Read page 8 as text
Quiz B 1-7 Chapter 1: Data and Decisions – Quiz B – Key 1. Consumer Reports Health routinely compares drugs in terms of effectiveness and safety. In summer 2008 they reviewed drugs used to treat arthritis. Information was reported on convenience of use (how many pills required each day), possible side effects (e.g., dizziness, stomach upset), cost, and ratings of effectiveness in relieving symptoms (very effective, somewhat effective, not effective). Describe the W’s for the information given. • Who: drugs to treat arthritis currently on the market • What: convenience of use, side effects, cost, effectiveness ratings • When: summer 2008 • Where: not specified, probably United States • How: testing on drugs • Why: information for potential consumers/patients 2. List the variables reported in the Consumer Reports Health article on drugs used to treat arthritis. If the variable is quantitative, give the units. If the variable is categorical, indicate whether it is nominal or ordinal. Categorical: Side effect (nominal), effectiveness rating (ordinal) Quantitative: Convenience of use (number of pills), Cost ($) 3. The Human Resources Department of a large corporation maintains records on its employees. The table displays some of these data. List the variables in the data set. Indicate whether each variable is categorical or quantitative. If the variable is quantitative, give the units. If the variable is categorical, indicate whether it is nominal or ordinal.
Page 9 Read page 9 as text
1-8 Chapter 1 Data and Decisions Age Employment Category Education Participates in Wellness Program? Paycheck Benefit Deductions 32 Clerical High School Yes $250 52 Professional College No $120 60 Professional Junior College Yes $0 28 Clerical High School No $120 Categorical: Employment Category (nominal), Education (ordinal), Participation in Wellness Program? (nominal) Quantitative: Age (years), Paycheck Benefit Deductions ($) 4. For each of the following, indicate whether the data are cross-sectional or time series: • Company quarterly profits Time Series • Percentage of American adults who work full time Cross-Sectional • Historical closing stock prices Time Series
Page 10 Read page 10 as text
Quiz C 1-9 Chapter 1: Data and Decisions – Quiz C Name_________________________ 1.1.1 Identify various aspects of studies and experiments and/or classify variables. 1. Consumer Reports National Research Center routinely compares products and services. A poll of more than 1,800 U.S. residents was conducted shortly after the 2008 holiday season. What they found was that fewer people than in the previous year tipped their service providers (newspaper carrier, barber, mail carrier, hairdresser, garbage collector) or the amount that consumers tip for specific services was reduced.. Information was reported on the type of service, whether a tip or gift was given, and the median total value of the tip. Describe the W’s for the information given. • Who: • What: • When: • Where: • How: • Why: 1.2.1 Identify various aspects of studies and experiments and/or classify variables. 2. List the variables reported in the Consumer Reports Magazine article on tipping. If the variable is quantitative, give the units. If the variable is categorical, indicate whether it is nominal or ordinal. 1.2.2 Identify various aspects of studies and experiments and/or classify variables. 3. Businesses in a U.S. city were surveyed about information to provide to prospective employees after graduating from business school. The table displays some of these data. List the variables in the data set. Indicate whether each variable is categorical or quantitative. If the variable is quantitative, give the units. If the variable is categorical, indicate whether it is nominal or ordinal. Employment Category Require an MBA Degree? Prefer Graduates with Work Experience? Median Salary of New Graduates Sales No No $35,000 Management Yes Yes $47,000 Accounting No Yes $52,000 Advertising No No $45,000 1.2.3 Identify various aspects of studies and experiments and/or classify variables. 4. For each of the following, indicate whether the data are cross-sectional or time series: • Dow Jones Index • Eating habits by age group • Attitudes toward abortion over past 10 years • Voting behavior data for a particular neighborhood
Page 11 Read page 11 as text
1-10 Chapter 1 Data and Decisions Chapter 1: Data and Decisions – Quiz C – Key 1. Consumer Reports National Research Center routinely compares products and services. A poll of more than 1,800 U.S. residents was conducted shortly after the 2008 holiday season. What they found was that fewer people tipped their service providers (newspaper carrier, barber, mail carrier, hairdresser, garbage collector) than in the previous year or the amount that consumers tip for specific services was reduced. Information was reported on the type of service, whether a tip or gift was given, the level of tipping, and the median total value of the tip. Describe the W’s for the information given. • Who: U.S. residents, most likely adults although not specified • What: Amount of tipping and type of tipping for service providers during the holiday season for this year and the previous year • When: shortly after the holiday season 2008 • Where: United States • How: A poll – not specified what type • Why: investigate consumer behavior in tipping service providers 2. List the variables reported in the Consumer Reports Magazine article on tipping. If the variable is quantitative, give the units. If the variable is categorical, indicate whether it is nominal or ordinal. Categorical: Whether or not someone tipped this year and/or previous year (nominal), type of tipping–gift or money (nominal), service provider who was tipped (nominal), level of tipping–low, medium, high (ordinal) Quantitative: Median value of tip ($),
Page 12 Read page 12 as text
Quiz C 1-11 3. Businesses in a U.S. city were surveyed about information to provide to prospective employees after graduating from business school. The table displays some of these data. List the variables in the data set. Indicate whether each variable is categorical or quantitative. If the variable is quantitative, give the units. If the variable is categorical, indicate whether it is nominal or ordinal. Employment Category Require an MBA Degree? Level of Work Experience Preferred? Median Salary of New Graduates Sales No None $35,000 Management Yes Extensive $47,000 Accounting No Moderate $52,000 Advertising No None $45,000 Categorical: Employment Category (nominal), Require an MBA Degree? (nominal), Level of Work Experience Preferred? (ordinal) Quantitative: Median Salary of New Graduates ($) 4. For each of the following, indicate whether the data are cross-sectional or time series: • Dow Jones Index Time Series • Eating habits by age group Cross-Sectional • Attitudes toward abortion over past 10 years Time Series • Voting behavior data for a particular neighborhood Cross-Sectional
Page 13 Read page 13 as text
1-12 Chapter 1 Data and Decisions Chapter 1: Data and Decisions – Quiz D – Multiple Choice Name________________________ 1.1.1 Identify various aspects of studies and experiments and/or classify variables. 1. In the fall of 2007, the Pew Internet & Life Project conducted telephone interviews with a sample of American adults aged 18 and older about online shopping. American adults aged 18 and older constitute the ______ of the study. A. Who B. What C. When D. Where E. How 1.2.1 Identify various aspects of studies and experiments and/or classify variables. 2. A few of the variables for which data were collected in the Pew Internet & Life Project study about online shopping include age, gender, income, and number of hours spent shopping online per month. Which of the variables is categorical? A. Age B. Gender C. Income D. Number of hours spent shopping online E. None 1.2.1 Identify various aspects of studies and experiments and/or classify variables. 3. The Pew Internet & Life Project study about online shopping asked respondents to indicate their education level on the following scale: Less than High School, High School, Some College, College +. Which of the following statements is (are) true? A. Education level is a categorical variable. B. Education level is nominal scaled. C. Education level is ordinal scaled. D. Both A and B E. Both A and C
Page 14 Read page 14 as text
Quiz D 1-13 1.1.1 Identify various aspects of studies and experiments and/or classify variables. 4. Consumer Reports Health routinely compares drugs in terms of effectiveness and safety. In summer 2008 they reviewed drugs used to treat arthritis. Among the information reported was convenience of use (how many pills required each day) and possible side effects (e.g., dizziness, stomach upset). Convenience of use and possible side effects constitute the ________ of the study. A. Who B. What C. When D. Where E. How 1.1.1 Identify various aspects of studies and experiments and/or classify variables. 5. What is the “Who” in a Consumer Reports Health study on the effectiveness and safety of drugs used to treat arthritis? A. drugs to treat arthritis currently on the market B. convenience of use and possible side effects C. summer 2008 D. the United States E. testing on drugs 1.2.1 Identify various aspects of studies and experiments and/or classify variables. 6. A Consumer Reports Health study on the effectiveness and safety of arthritis drugs collected data on possible side effects. This is what kind of variable? A. Quantitative B. Categorical C. Nominal D. Both A and C E. Both B and C 1.2.1 Identify various aspects of studies and experiments and/or classify variables. 7. A Consumer Reports Health study on arthritis drugs takes into consideration cost. Cost is A. is a nominal variable. B. is a categorical variable. C. is a quantitative variable. D. is an ordinal variable. E. is an irrelevant variable.
Page 15 Read page 15 as text
1-14 Chapter 1 Data and Decisions 1.2.1 Identify various aspects of studies and experiments and/or classify variables. 8. The Human Resources Department of a large corporation maintains records on its employees. Data are maintained of the following variables: Age, Employment Category, Education, Whether or not the employee participates in a wellness program, and Paycheck benefit deductions. Which of these variables are categorical? A. Age, Employment Category , and Education B. Employment Category, Education , and Whether or not the employee participates in a wellness program C. Education, Whether or not the employee participates in a wellness program , and Paycheck benefit deductions D. All of the variables E. None of the variables 1.2.3 Identify various aspects of studies and experiments and/or classify variables. 9. Which of the following is (are) based on cross sectional data? A. Company quarterly profits B. Percentage of American adults who work full time C. Historical closing stock prices D. All of the above E. None of the above. 1.2.3 Identify various aspects of studies and experiments and/or classify variables. 10. Which of the following is (are) time series data? A. Weekly receipts at a clothing boutique B. Monthly demand for an automotive part C. Quarterly sales of automobiles D. All of the above E. None of the above
Page 16 Read page 16 as text
Quiz D 1-15 Chapter 1: Data and Decisions – Quiz D – Key 1. A 2. B 3. E 4. B 5. A 6. E 7. C 8. B 9. B 10. D
Page 17 Read page 17 as text
1-16 Chapter 1 Data and Decisions Chapter 1: Data and Decisions – Quiz E – Multiple Choice Name___________________ 1.1.1 Identify various aspects of studies and experiments and/or classify variables. 1. A university is interested in gauging student satisfaction in its online MBA program. A survey is designed and administered via the Internet to a sample of students currently active in the program. Which of the following would best describe the cases? A. Participants B. Respondents C. Experimental Units D. Subjects E. Variables 1.2.1 Identify various aspects of studies and experiments and/or classify variables. 2. In a survey undertaken by a university to gauge student satisfaction in its online MBA program, one question asked students to indicate their employment status (unemployed, employed part-time, employed full-time). Which of the following is true? A. This variable is categorical. B. This variable is quantitative. C. This is an identifier variable. D. Both A and C. E. Both B and C. 1.2.1 Identify various aspects of studies and experiments and/or classify variables. 3. In a survey undertaken by a university to gauge student satisfaction in its online MBA program, one question asked students to indicate the number of credits they had transferred into the program. Which of the following is true? A. This variable is categorical. B. This variable is transactional. C. This variable is quantitative. D. This is an identifier variable. E. This variable is nominal.
Page 18 Read page 18 as text
Quiz E 1-17 1.1.1 Identify various aspects of studies and experiments and/or classify variables. 4. Researchers in e-commerce design an experiment to determine what factors are most important to online consumers when completing a transaction via the Internet. Individuals perform tasks on a set of Web sites and record their impressions about various attributes. Which of the following would best describe the cases? A. Participants B. Respondents C. Experimental Units D. Transactions E. Variables 1.2.1 Identify various aspects of studies and experiments and/or classify variables. 5. A popular travel magazine regularly reviews hotels worldwide. In a recent issue, it focused on hotels in Hawaii. Among the variables for which it provided data was whether or not the hotel included a spa. This is a A. quantitative variable. B. identifier variable. C. ordinal variable. D. categorical variable. E. transactional variable. 1.2.1 Identify various aspects of studies and experiments and/or classify variables. 6. A popular travel magazine regularly reviews hotels worldwide. In a recent issue, it focused on hotels in Hawaii. Among the variables for which it provided data was the price range for rooms with an ocean view. Which of the following statements is true? A. These data are transactional. B. This variable is quantitative and the units are $. C. This variable is quantitative and the units are number of rooms. D. This variable is qualitative and ordinal. E. These data are time series. 1.2.1 Identify various aspects of studies and experiments and/or classify variables. 7. A mid-priced chain of hotels, Hometown Suites , strives to make its guests “feel at home” by providing amenities such as microwaves in every room. Comment cards are used to get feedback on the importance of such amenities by asking guests to rate them using the scale: ___ Essential ___ Important ___ Not Important. These data are A. qualitative. B. nominal. C. ordinal. D. both A and B. E. both A and C.
Page 19 Read page 19 as text
1-18 Chapter 1 Data and Decisions 1.3.1 Identify various aspects of studies and experiments and/or classify variables. 8. A locally owned spa, Alexander’s , is interested in adding a tea room that not only offers specialty teas but an organic lunch menu. In order to determine how many of its regular customers would be interested in such an addition, Alexander’s sent out a short e- mail questionnaire. The source of these data is A. the Internet. B. transactional. C. a designed survey. D. a designed experiment. E. secondary. 1.2.3 Identify various aspects of studies and experiments and/or classify variables. 9. A locally owned spa, Alexander’s , is interested in adding a tea room that not only offers specialty teas but an organic lunch menu. In order to determine how many of its regular customers would be interested in such an addition, Alexander’s sent out a short e- mail questionnaire. One question asked its customers to indicate how much they spend monthly on all natural, organic products. These data are A. cross-sectional. B. time series. C. categorical. D. transactional. E. experimental. 1.2.3 Identify various aspects of studies and experiments and/or classify variables. 10. A mid-priced chain of hotels, Hometown Suites , collects data on monthly occupancy rates for forecasting and planning purposes. These data are A. cross-sectional. B. time series. C. categorical. D. transactional. E. experimental.
Page 20 Read page 20 as text
Quiz E 1-19 Chapter 1: Data and Decisions – Quiz E – Key 1. B 2. A 3. C 4. A 5. D 6. B 7. E 8. C 9. A 10. B
Page 21 Read page 21 as text
1-20 Chapter 1 Data and Decisions Chapter 1: Data and Decisions – Quiz F– Multiple Choice Name___________________ 1.1.1 Identify various aspects of studies and experiments and/or classify variables. 1. In June, 2013, Viamedia sponsored an online survey to sample a group of American adults aged 18 and older about watching television. American adults aged 18 and older constitute the ______ of the study. A. Who B. What C. When D. Where E. How 1.2.1 Identify various aspects of studies and experiments and/or classify variables. 2. A few of the variables for which data were collected in the Viamedia survey about television viewing include age, gender, income, and type of device used to watch television. Which of the variables is categorical? A. Age B. Type of device used to watch television C. Income D. All E. None 1.2.1 Identify various aspects of studies and experiments and/or classify variables. 3. The data collected in a recent (2012) Nielsen Global Survey analyzed Asian American demographics. Which of the following statements is (are) true? A. Education level is a categorical variable. B. Education level is nominal scaled. C. Education level is ordinal scaled. D. Both A and B E. Both A and C 1.1.1 Identify various aspects of studies and experiments and/or classify variables. 4. Businesses are interested in the work experience of recent graduates from a local business school. Whether or not the graduates have work experience constitutes the ________ of the study. A. Who B. What C. When D. Where E. How
Page 22 Read page 22 as text
Quiz F 1-21 1.1.1 Identify various aspects of studies and experiments and/or classify variables. 5. What is the “What” in a Consumer Reports Tipping study on the level of tipping during the current holiday season compared to the last holiday season? A. whether or not tipped B. amount of tip compared to last year C. the type of tip D. the United States 1.2.1 Identify various aspects of studies and experiments and/or classify variables. 6. A Consumer Reports survey on the level of tipping for service providers. This is what kind of variable? A. Quantitative B. Ordinal C. Nominal D. Both A and C E. Both B and C 1.2.1 Identify various aspects of studies and experiments and/or classify variables. 7. A Consumer Reports study on tipping takes into consideration median amount of tipping for service providers. Tipping is A. is a nominal variable. B. is a categorical variable. C. is a quantitative variable. D. is an ordinal variable. E. is an irrelevant variable. 1.2.1 Identify various aspects of studies and experiments and/or classify variables. 8. The Human Resources Department of a large corporation maintains records on its employees. Data are maintained of the following variables: Age, Employment Category, Education, and Whether or not the employee has an advanced degree. Which of these variables are categorical? A. Age, Employment Category , and Education B. Employment Category and Education C. Education and Whether or not the employee has an advanced degree D. All of the variables E. None of the variables
Page 23 Read page 23 as text
1-22 Chapter 1 Data and Decisions 1.2.3 Identify various aspects of studies and experiments and/or classify variables. 9. Which of the following is (are) based on cross sectional data? A. Company quarterly profits B. Percentage of American adults who work full time C. Dow Jones Index D. All of the above E. None of the above. 1.2.3 Identify various aspects of studies and experiments and/or classify variables. 10. Which of the following is (are) time series data? A. Monthly receipts at an apparel shop B. Monthly demand for a technology item C. Dow Jones Index D. All of the above E. None of the above
Page 24 Read page 24 as text
Quiz F 1-23 Chapter 1: Data and Decisions – Quiz F – Key 1. A 2. B 3. E 4. B 5. B 6. B 7. C 8. B 9. B 10. D
Page 25 Read page 25 as text
2-1 Chapter 2: Displaying and Describing Categorical Data – Quiz A Name_____________________________________ A large national retailer of electronics conducted a survey to determine consumer preferences for various brands of point and shoot digital cameras. The table summarizes responses by brand and gender. 2.1.3 Create and use frequency and relative frequency distributions and their displays. 1. Identify the variables and tell whether each is categorical or quantitative. 2.1.3 Create and use frequency and relative frequency distributions and their displays. 2. Find each of the following percentages. a. What percent of the responses were males who prefer Nikon? b. What percent of the male responses prefer Olympus? c. What percent of the consumers who choose Nikon were females? 2.3.4 Determine if displays of data are appropriate. 3. What is the marginal distribution of brands? 2.2.4 Determine if displays of data are appropriate. 4. Prepare an appropriate chart to display the marginal distribution of brands. 2.3.4 Determine if displays of data are appropriate. 5. Write a sentence or two about the conditional relative frequency distribution of the brands among female respondents. Female Male Total Cannon Power Shot 73 59 132 Nikon Cool Pix 49 47 96 Sony Cyber Shot 58 33 91 Panasonic Lumix 35 30 65 Fujifilm Finepix 45 28 73 Olympus S/V 37 41 78 Other Brands 86 67 153 Total 383 305 688
Page 26 Read page 26 as text
2-2 Chapter 2 Displaying and Describing Categorical Data 2.2.1 Determine if displays of data are appropriate. 6. Consider the following side by side bar chart for the data above: Does the chart indicate that brand preference is independent of gender? Explain.
Page 27 Read page 27 as text
Quiz A 2-3 Chapter 2: Displaying and Describing Categorical Data – Quiz A – Key A large national retailer of electronics conducted a survey to determine consumer preferences for various brands of digital cameras. The table summarizes responses by brand and gender. 1. Identify the variables and tell whether each is categorical or quantitative. Gender and Brand; both categorical. 2. Find each of the following percentages. a. What percent of the responses were males who prefer Nikon? 6.8% (47/688) b. What percent of the male responses prefer Olympus? 13.4% (41/305) c. What percent of the consumers who choose Nikon were females? 51.0% (49/96) 3. What is the marginal distribution of brands? 132 for Cannon Power Shot, 96 for Nikon Cool Pix, 91 for Sony Cyber Shot, 65 for Panasonic Lumix, 73 for Fujifilm Finepix, 78 for Olympus S/V and 153 for other brands. 4. Prepare an appropriate chart to display the marginal distribution of brands. Either a bar chart (shown below) or a pie chart is appropriate. Female Male Total Cannon Power Shot 73 59 132 Nikon Cool Pix 49 47 96 Sony Cyber Shot 58 33 91 Panasonic Lumix 35 30 65 Fujifilm Finepix 45 28 73 Olympus S/V 37 41 78 Other Brands 86 67 153 Total 383 305 688
Page 28 Read page 28 as text
2-4 Chapter 2 Displaying and Describing Categorical Data 5. Write a sentence or two about the conditional relative frequency distribution of the brands among female respondents. Among females, 19.1% prefer Cannon, 12.8% prefer Nikon, 15.1% prefer Sony, 9.1% prefer Panasonic, 11.7% prefer Fujifilm, and 9.7% prefer Olympus. The remaining 22.5% of females preferred other brands. 6. Consider the following side by side bar chart for the data above: Does the chart indicate that brand preference is independent of gender? Explain. Brand preference appears to be independent of gender for about half of the brands. The other half of the brand preferences seem to have preference based on gender. These data provide little evidence of a difference in digital camera choice based on gender.
Page 29 Read page 29 as text
Quiz B 2-5 Chapter 2: Displaying and Describing Categorical Data – Quiz B Name_____________________________________ A full service brokerage firm gathered information on how their clients were investing for retirement. Based on age, clients were categorized according to where the largest percentage of their retirement portfolio was invested. The table below summarized the data. 2.1.3 Create and use frequency and relative frequency distributions and their displays. 1. Identify the variables and tell whether each is categorical or quantitative. 2.1.3 Create and use frequency and relative frequency distributions and their displays. 2. Find each of the following percentages. a. What percent of the clients are over age 50 who invests in mutual funds? b. What percent of clients over age 50 invest in mutual funds? c. What percent of the mutual fund investors are over age 50? 2.3.4 Determine if displays of data are appropriate. 3. What is the marginal distribution of age? 2.2.4 Determine if displays of data are appropriate. 4. Prepare an appropriate chart to display the marginal distribution of age. 2.1.3 Create and use frequency and relative frequency distributions and their displays. 5. Write a sentence or two about the conditional relative frequency distribution of mode of investment for clients age 50 or younger. Age 50 or Younger Over Age 50 Total Mutual Funds 30 34 64 Stocks 37 45 82 Bonds 19 23 42 Total 86 102 188
Page 30 Read page 30 as text
2-6 Chapter 2 Displaying and Describing Categorical Data 2.4.3 Create and use frequency and relative frequency distributions and their displays. 6. Consider the following side by side bar chart for the data above: Does the chart indicate that mode of investment is independent of age? Explain. 2.5.4 Create and use frequency and relative frequency distributions and their displays. 7. A newspaper examined the town's two hospitals and found that over the last six months at Mercy Hospital 79% of the patients survived while at County Hospital 90% survived. The table below summarizes the findings. Lived Died Total % who lived Mercy Hospital 790 210 1000 79.0% City Hospital 900 100 1000 90.0% On closer investigation, it was observed that there was a difference in survival between patients who were admitted in poor condition or worse compared with patients admitted in fair condition or better. The following tables were created: Patients admitted in poor condition or worse: Lived Died Total % who lived Mercy Hospital 210 200 410 City Hospital 40 70 110 Investment Bonds Stocks Mutual Funds Older Younger Older Younger Older Younger 60 50 40 30 20 10 0 Data Percent within levels of Investment.
Page 31 Read page 31 as text
Quiz B 2-7 Patients admitted in fair condition or better: Lived Died Total % who lived Mercy Hospital 580 10 590 City Hospital 860 30 890 a) Fill in the four blanks in the two tables above with percentages. b) Compare the percentages in the first table with those in the next two tables. Do you observe anything unusual? c) Which hospital would you choose and why?
405 more pages in the full document
Unlock it once and it stays in your library, ready to chat with or turn into flashcards.
Unlock the full documentMore Statistics study materials
See all Textbook Guides
Solution Manual for Business Statistics, 4th Edition
Statistics
582 pages125downloadsFeb 2025 Textbook Guides
Solution Manual for Business Statistics: A First Course, 3rd Edition
Statistics
348 pagesMay 2025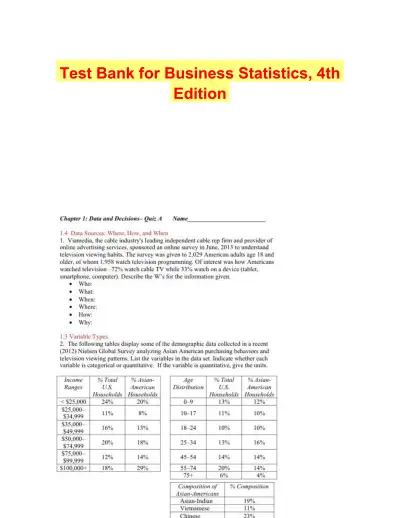 Exam Guides
Test Bank for Business Statistics, 4th Edition
Statistics
714 pagesMay 2025 Exam Guides
Test Bank for Biostatistics for the Biological and Health Sciences , 2nd Edition
Statistics
182 pages161downloadsFeb 2025 Exam Guides
Elementary Statistics, 13th Edition Test Bank
Statistics
239 pages160downloadsFeb 2025 Textbook Guides
Solution Manual For Statistics for Managers Using Microsoft Excel, 7th Edition
Statistics
1418 pages158downloadsFeb 2025 Textbook Guides
Statistics for Managers Using Microsoft Excel 8th Edition Solution Manual
Statistics
1343 pages156downloadsFeb 2025 Textbook Guides
Essentials of Social Statistics for a Diverse Society Second Edition Solution Manual
Statistics
137 pages135downloadsFeb 2025
Study this document with CramX
Once it is in your library, every tool can work from it.