CramX Logo
Elementary Statistics: Picturing the World, 6th Edition Test Bank - Document preview page 1

Elementary Statistics: Picturing the World, 6th Edition Test Bank - Page 1

Document preview content for Elementary Statistics: Picturing the World, 6th Edition Test Bank

Elementary Statistics: Picturing the World, 6th Edition Test Bank

Elementary Statistics: Picturing the World, 6th Edition Test Bank makes learning easy with a structured format, concise explanations, and plenty of practice material.

Eli Simmons
Contributor
4.6
0
12 months ago
Preview (16 of 285 Pages)
100%
Log in to unlock
Page 1 of 16
Elementary Statistics: Picturing the World, 6th Edition Test Bank - Page 1 preview image
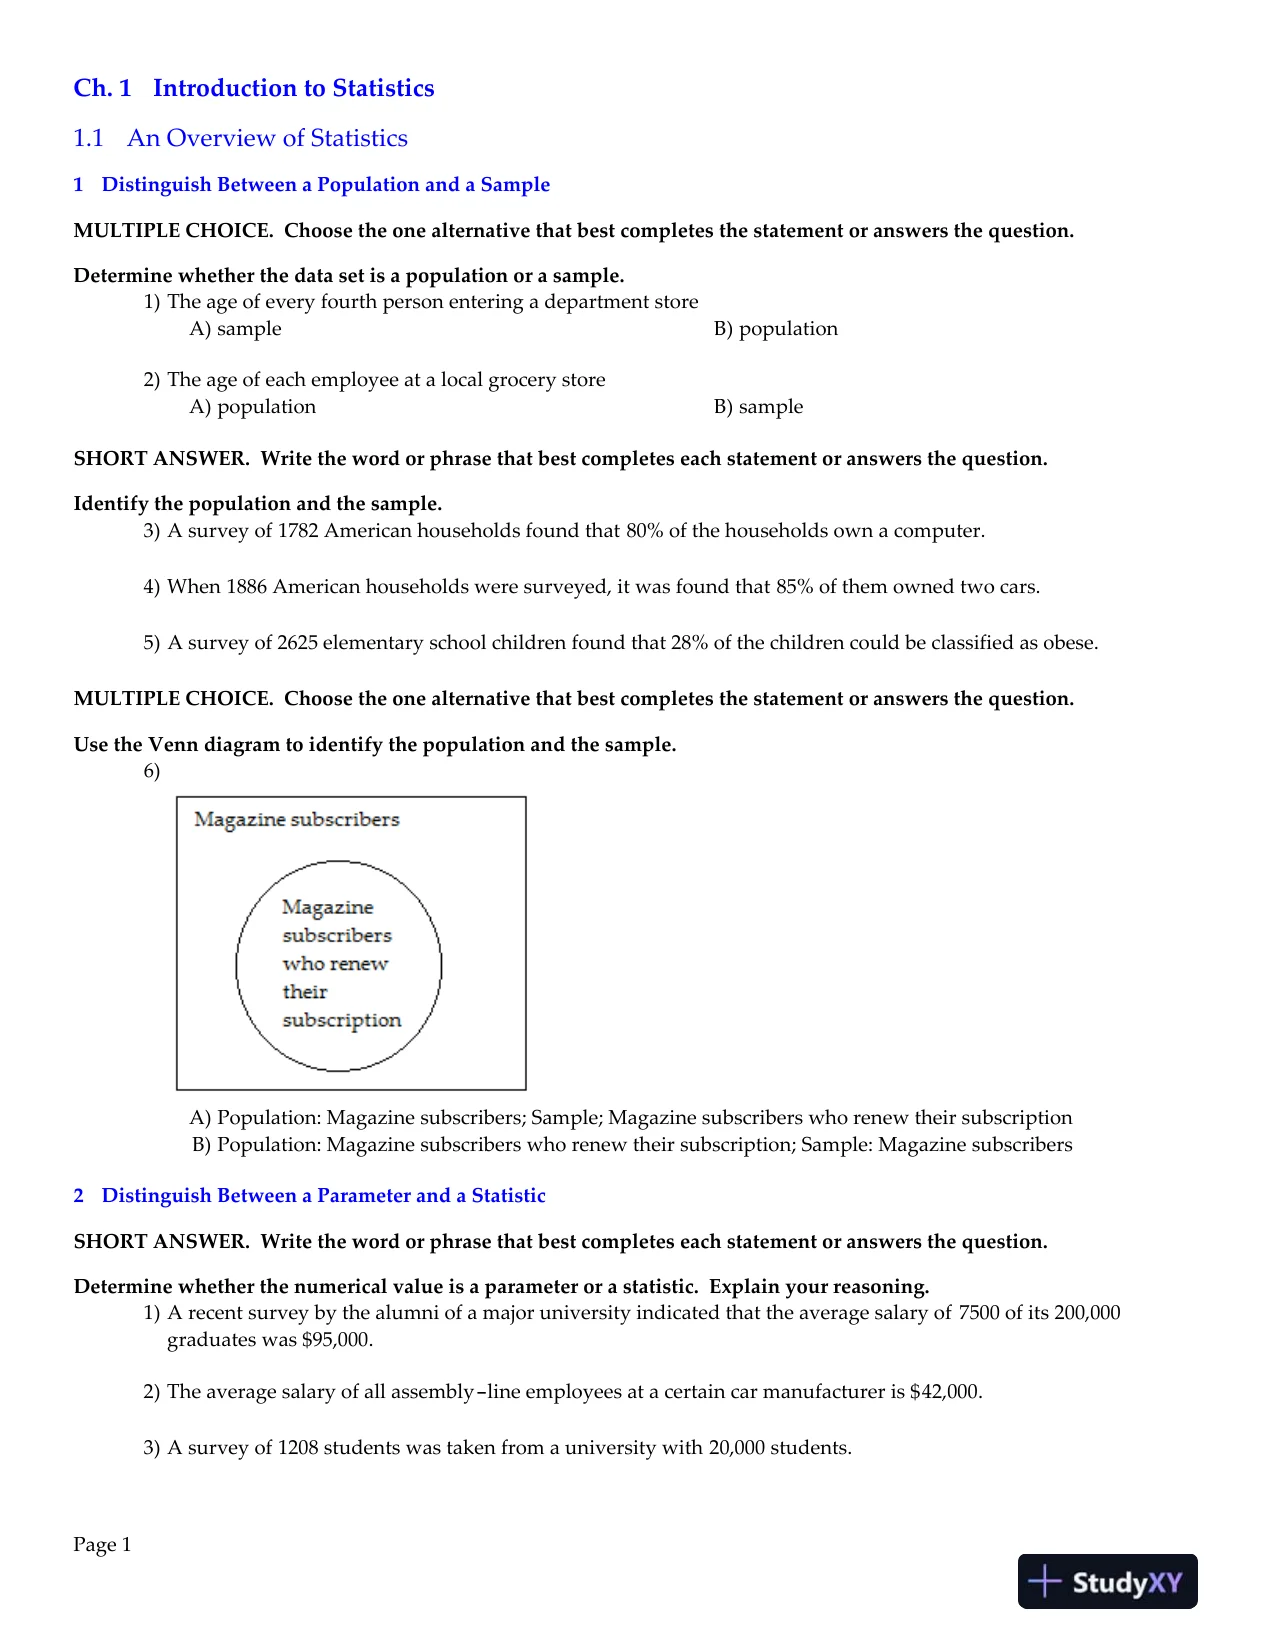
Ch.1IntroductiontoStatistics1.1AnOverviewofStatistics1DistinguishBetweenaPopulationandaSampleMULTIPLECHOICE.Choosetheonealternativethatbestcompletesthestatementoranswersthequestion.Determinewhetherthedatasetisapopulationorasample.1) TheageofeveryfourthpersonenteringadepartmentstoreA) sampleB) population2) TheageofeachemployeeatalocalgrocerystoreA) populationB) sampleSHORTANSWER.Writethewordorphrasethatbestcompleteseachstatementoranswersthequestion.Identifythepopulationandthesample.3) Asurveyof1782Americanhouseholdsfoundthat80%ofthehouseholdsownacomputer.4) When1886Americanhouseholdsweresurveyed,itwasfoundthat85%ofthemownedtwocars.5) Asurveyof2625elementaryschoolchildrenfoundthat28%ofthechildrencouldbeclassifiedasobese.MULTIPLECHOICE.Choosetheonealternativethatbestcompletesthestatementoranswersthequestion.UsetheVenndiagramtoidentifythepopulationandthesample.6)A) Population:Magazinesubscribers;Sample;MagazinesubscriberswhorenewtheirsubscriptionB) Population:Magazinesubscriberswhorenewtheirsubscription;Sample:Magazinesubscribers2DistinguishBetweenaParameterandaStatisticSHORTANSWER.Writethewordorphrasethatbestcompleteseachstatementoranswersthequestion.Determinewhetherthenumericalvalueisaparameterorastatistic.Explainyourreasoning.1) Arecentsurveybythealumniofamajoruniversityindicatedthattheaveragesalaryof7500ofits200,000graduateswas$95,000.2) Theaveragesalaryofallassembly-lineemployeesatacertaincarmanufactureris$42,000.3) Asurveyof1208studentswastakenfromauniversitywith20,000 students.Page1
Page 2 of 16
Elementary Statistics: Picturing the World, 6th Edition Test Bank - Page 2 preview image
Page 3 of 16
Elementary Statistics: Picturing the World, 6th Edition Test Bank - Page 3 preview image3DistinguishBetweenDescriptiveStatisticsandInferentialStatisticsMULTIPLECHOICE.Choosetheonealternativethatbestcompletesthestatementoranswersthequestion.Identifywhetherthestatementdescribesinferentialstatisticsordescriptivestatistics.1) Theaverageageofthestudentsinastatisticsclassis22 years.A) descriptivestatisticsB) inferentialstatistics2) ThechancesofwinningtheCaliforniaLotteryareonechanceintwenty-twomillion.A) inferentialstatisticsB) descriptivestatistics3) Thereisarelationshipbetweensmokingcigarettesandgettingemphysema.A) inferentialstatisticsB) descriptivestatistics4) Frompastfigures,itispredictedthat41%oftheregisteredvotersinCaliforniawillvoteintheJuneprimary.A) inferentialstatisticsB) descriptivestatistics5) Basedonpreviousclients,amarriagecounselorconcludesthatthemajorityofmarriagesthatbeginwithcohabitationbeforemarriagewillresultindivorce.A) inferentialstatisticsB) descriptivestatistics4ConceptsSHORTANSWER.Writethewordorphrasethatbestcompleteseachstatementoranswersthequestion.Provideanappropriateresponse.1) Explainthedifferencebetweenasampleandapopulation.2) Ifyouhadtodoastatisticalstudy,wouldyouuseasampleorapopulation?Why?1.2DataClassification1DistinguishBetweenQualitativeandQuantitativeDataMULTIPLECHOICE.Choosetheonealternativethatbestcompletesthestatementoranswersthequestion.Determinewhetherthedataarequalitativeorquantitative.1) thecolorsofautomobilesonausedcarlotA) qualitativeB) quantitative2)thenumberofcomplaintlettersreceivedbytheUnitedStatesPostalServiceinagivendayA) quantitativeB) qualitative3) thenumberofseatsinamovietheaterA) quantitativeB) qualitative4) thenumbersontheshirtsofagirlʹssoccerteamA) qualitativeB) quantitative2ClassifyDatawithRespecttotheFourLevelsofMeasurementMULTIPLECHOICE.Choosetheonealternativethatbestcompletesthestatementoranswersthequestion.Identifythedatasetʹslevelofmeasurement.1) haircolorofwomenonahighschooltennisteamA) nominalB) ordinalC) intervalD) ratioPage2
Page 4 of 16
Elementary Statistics: Picturing the World, 6th Edition Test Bank - Page 4 preview image2) numbersontheshirtsofagirlʹssoccerteamA) nominalB) ordinalC) intervalD) ratio3) agesofstudentsinastatisticclassA) ratioB) ordinalC) intervalD) nominal4) temperaturesof73selectedrefrigeratorsA) intervalB) ordinalC) nominalD) ratio5) numberofmilligramsoftarin85cigarettesA) ratioB) ordinalC) intervalD) nominal6) numberofpagesinyourstatisticsbookA) ratioB) ordinalC) intervalD) nominal7) marriagestatus(married,single,ordivorced)ofthefacultyattheUniversityofColoradoA) nominalB) ordinalC) intervalD) ratio8) listof1239socialsecuritynumbersA) nominalB) ordinalC) intervalD) ratio9) theratingsofamovierangingfromʺpoorʺtoʺgoodʺtoʺexcellentʺA) ordinalB) nominalC) intervalD) ratio10) thefinalgrades(A,B,C,D,andF)forstudentsinastatisticsclassA) ordinalB) nominalC) intervalD) ratio11) theannualsalariesforallteachersinCaliforniaA) ratioB) ordinalC) intervalD) nominal12) listofzipcodesforChicagoA) nominalB) ordinalC) intervalD) ratio13) thenationalitieslistedinarecentsurvey(forexample,Asian,European,orHispanic).A) nominalB) ordinalC) intervalD) ratio14) theamountsoffat(ingrams)in29cookiesA) ratioB) ordinalC) intervalD) nominal15) theyearsthesummerOlympicswereheldintheUnitedStatesA) intervalB) ordinalC) nominalD) ratio16) numbersoftouchdownsscoredbyamajoruniversityinfiverandomlyselectedgames42434A) ratioB) ordinalC) intervalD) nominal17) theaveragedailytemperatures(indegreesFahrenheit)onfiverandomlyselecteddays3422312138A) intervalB) nominalC) ordinalD) ratio18) manuscriptsratedʺacceptableʺorʺunacceptableʺA) ordinalB) nominalC) ratioD) intervalPage3
Page 5 of 16
Elementary Statistics: Picturing the World, 6th Edition Test Bank - Page 5 preview image19) thelengths(inminutes)ofthetoptenmovieswithrespecttoticketsalesin2007A) ratioB) nominalC) ordinalD) interval20) thedatalistedonthehorizontalaxisinthegraphA) nominalB) intervalC) ordinalD) ratio21) thedatalistedonthehorizontalaxisinthegraphA) ratioB) nominalC) ordinalD) interval3ConceptsSHORTANSWER.Writethewordorphrasethatbestcompleteseachstatementoranswersthequestion.Provideanappropriateresponse.1) Explainthedifferencesbetweentheintervalandratiolevelsofmeasurement.2) ExplainwhydataexpressedwiththeCelsiustemperaturescaleisattheintervallevelofmeasurementratherthantheratiolevel.Page4
Page 6 of 16
Elementary Statistics: Picturing the World, 6th Edition Test Bank - Page 6 preview image1.3DataCollectionandExperimentalDesign1DecideWhetherStudyisObservationalStudyorExperimentMULTIPLECHOICE.Choosetheonealternativethatbestcompletesthestatementoranswersthequestion.Determinewhetherthestudyisanobservationalstudyoranexperiment.1) Amedicalresearcherobtainsasampleofadultssufferingfromdiabetes.Sherandomlyassigns67 peopletoatreatmentgroupand67toaplacebogroup.Thetreatmentgroupreceivesamedicationoveraperiodofthreemonthsandtheplacebogroupreceivesaplacebooverthesametimeframe.Attheendofthreemonthsthepatientsʹsymptomsareevaluated.A) experimentB) observationalstudy2) Apollisconductedinwhichprofessionalmusiciansareaskedtheirages.A) observationalstudyB) experiment3) Apollsterobtainsasampleofstudentsandasksthemhowtheywillvoteonanupcomingreferendum.A) observationalstudyB) experiment4) Thepersonneldirectoratalargecompanywouldliketodeterminewhetherthecompanycafeteriaiswidelyusedbyemployees.Shecallseachemployeeandasksthemwhethertheyusuallybringtheirownlunch,eatatthecompanycafeteria,orgooutforlunch.A) observationalstudyB) experiment5) Ascientistwasstudyingtheeffectsofanewfertilizeroncropyield.Sherandomlyassignedhalfoftheplotsonafarmtogrouponeandtheremainingplotstogrouptwo.Ontheplotsingroupone,thenewfertilizerwasusedforayear.Ontheplotsingrouptwo,theoldfertilizerwasused.Attheendoftheyeartheaveragecropyieldfortheplotsingrouponewascomparedwiththeaveragecropyieldfortheplotsingrouptwo.A) experimentB) observationalstudy6) Aresearcherobtainedarandomsampleof100smokersandarandomsampleof100nonsmokers.Afterinterviewingall200participantsinthestudy,theresearchercomparedtherateofdepressionamongthesmokerswiththerateofdepressionamongnonsmokers.A) observationalstudyB) experimentSHORTANSWER.Writethewordorphrasethatbestcompleteseachstatementoranswersthequestion.Identifytheexperimentalunitsandtreatmentsusedintheexperiment.7) Amedicalresearchercenterwantstotesttheeffectivenessofanewdiabetesmedication.Thecompanyidentifies82adultssufferingfromasimilarformofdiabetes.Thesubjectsarerandomlyassignedtotwogroups.Onegroupisgivenamedicationandtheotherisgivenaplacebothatlooksexactlylikethemedication.Afterthreemonths,thesubjectsʹsymptomsarestudiedandcompared.2IdentifyaBiasedSampleSHORTANSWER.Writethewordorphrasethatbestcompleteseachstatementoranswersthequestion.Provideanappropriateresponse.1) Explainwhatbiasthereisinastudydoneentirelyonline.2) AreportsponsoredbytheCaliforniaCitrusCommissionstatedthatcholesterollevelscanbeloweredbydrinkingatleastoneglassofacitrusproducteachday.Determineifthereportisbiased.3) Alocalnewspaperranasurveybyasking,ʺDoyousupportthedeploymentofaweaponthatcouldkillmillionsofinnocentpeople?ʺDeterminewhetherthesurveyquestionisbiased.Page5
Page 7 of 16
Elementary Statistics: Picturing the World, 6th Edition Test Bank - Page 7 preview image3IdentifySamplingTechniquesMULTIPLECHOICE.Choosetheonealternativethatbestcompletesthestatementoranswersthequestion.Identifythesamplingtechniqueused.1) Thirty-fivesophomores,24juniorsand25 seniorsarerandomlyselectedfrom388sophomores,418 juniorsand573seniorsatacertainhighschool.A) stratifiedB) randomC) clusterD) convenienceE) systematic2) Everyfifthpersonboardingaplaneissearchedthoroughly.A) systematicB) randomC) clusterD) convenienceE) stratified3) Atalocalcommunitycollege,fivestatisticsclassesarerandomlyselectedoutof20andallofthestudentsfromeachclassareinterviewed.A) clusterB) randomC) convenienceD) systematicE) stratified4) Aresearcherrandomlyselectsandinterviewsfiftymaleandfiftyfemaleteachers.A) stratifiedB) randomC) clusterD) convenienceE) systematic5) Aresearcherforanairlineinterviewsallofthepassengersonfiverandomlyselectedflights.A) clusterB) randomC) convenienceD) systematicE) stratified6) Acommunitycollegestudentinterviewseveryoneinastatisticsclasstodeterminethepercentageofstudentsthatownacar.A) convenienceB) randomC) clusterD) systematicE) stratified7) Basedon11,000responsesfrom48,000 questionnairessenttoitsalumni,amajoruniversityestimatedthattheannualsalaryofitsalumniwas$118,000peryear.A) randomB) stratifiedC) clusterD) convenienceE) systematic8) Inarecenttelevisionsurvey,participantswereaskedtoanswerʺyesʺorʺnoʺtothequestionʺAreyouinfavorofthedeathpenalty?ʺSixthousandfivehundredrespondedʺyesʺwhile5100respondedʺnoʺ.Therewasafifty-centchargeforthecall.A) convenienceB) randomC) clusterD) stratifiedE) systematic9) Alobbyistforamajorairspacefirmassignsanumbertoeachlegislatorandthenusesacomputertorandomlygeneratetennumbers.Thelobbyistcontactsthelegislatorscorrespondingtothesenumbers.A) randomB) convenienceC) clusterD) stratifiedE) systematic10) Toensurecustomersatisfaction,every5thphonecallreceivedbycustomerservicewillbemonitored.A) systematicB) randomC) clusterD) stratifiedE) convenience11) Amarketresearcherrandomlyselects100driversunder45 yearsofageand200driversover45 yearsofage.A) stratifiedB) randomC) clusterD) convenienceE) systematic12) Toavoidworkinglate,thequalitycontrolmanagerinspectsthelast10itemsproducedthatday.A) convenienceB) randomC) clusterD) stratifiedE) systematic13) Thenamesof70contestantsarewrittenon70cards.Thecardsareplacedinabag,andthreenamesarepickedfromthebag.A) randomB) stratifiedC) clusterD) convenienceE) systematic14) Aresearcherrandomlyselected50ofthenationʹsmiddleschoolsandinterviewedalloftheteachersateachschool.A) clusterB) randomC) stratifiedD) convenienceE) systematicPage6
Page 8 of 16
Elementary Statistics: Picturing the World, 6th Edition Test Bank - Page 8 preview imageSHORTANSWER.Writethewordorphrasethatbestcompleteseachstatementoranswersthequestion.Provideanappropriateresponse.15) Afterahurricane,adisasterareaisdividedinto200equalgrids.Thirtyofthegridsareselectedandeveryoccupiedhouseholdinthegridisinterviewedtohelpfocusreliefefforts.Selectthenumbersofthefirstfivegridsthatbelongtotheclustersample.163487693890169513925588771015092097915716) Thereare750incomingfreshmenattendingauniversitythisfall.Aresearcherwishestosendquestionnairestoasampleof30ofthemtocompleteregardingtheirdrinkinghabits.Selectthenumbersofthefirstfivefreshmenwhobelongtothesimplerandomsample.163487693890169513925588771015092097915717) Acollegeemploys85facultymembers.Withoutreplacement,selectthenumbersofthefivememberswhowillserveonthetenurecommitteenextyear.163487693890169513925588771015092097915718) Ofthe5000outpatientsreleasedfromalocalhospitalinthepastyear,onehundredwerecontactedandaskedtheiropiniononthecaretheyreceived.Selectthefirstfivepatientswhobelongtothesimplerandomsample.1634876938901695139255887710150920979157MULTIPLECHOICE.Choosetheonealternativethatbestcompletesthestatementoranswersthequestion.Determinewhetheryouwouldtakeacensusoruseasampling.Ifyouwoulduseasampling,decidewhatsamplingtechniqueyouwoulduse.19) Theaverageageofthe80residentsofanassistedlivingcenter.A) censusB) randomsamplingC) stratifiedsamplingD) clustersampling4ConceptsSHORTANSWER.Writethewordorphrasethatbestcompleteseachstatementoranswersthequestion.Provideanappropriateresponse.1) Explainthedifferencesbetweenclustersamplingandstratifiedsampling.2) Explainthedifferencebetweenacensusandasamplinganddescribetheadvantagesanddisadvantagesofeach.Page7
Page 9 of 16
Elementary Statistics: Picturing the World, 6th Edition Test Bank - Page 9 preview imageCh.1IntroductiontoStatisticsAnswerKey1.1AnOverviewofStatistics1DistinguishBetweenaPopulationandaSample1) A2) A3) population:collectionofallAmericanhouseholds;sample:collectionof1782 Americanhouseholdssurveyed4) population:collectionofallAmericanhouseholds;sample:collectionof1886 Americanhouseholdssurveyed5) population:elementaryschoolchildren;sample:collectionof2625elementaryschoolchildrensurveyed.6) A2DistinguishBetweenaParameterandaStatistic1) Itdescribesastatisticbecausethenumber$95,000 isbasedonasubsetofthepopulation.2) Itdescribesaparameterbecausethe$42,000 isbasedonalltheworkersatthecarmanufacturer.3) Itdescribesastatisticbecausethenumber1208 isbasedonasubsetofthepopulation.3DistinguishBetweenDescriptiveStatisticsandInferentialStatistics1) A2) A3) A4) A5) A4Concepts1) Apopulationisthecollectionofalloutcomes,responses,measurements,orcountsthatareofinterest..Asampleisasubsetofapopulation.2) Asamplewouldbeused.Itisusuallyimpracticaltoobtainallthepopulationdata.1.2DataClassification1DistinguishBetweenQualitativeandQuantitativeData1) A2) A3) A4) A2ClassifyDatawithRespecttotheFourLevelsofMeasurement1) A2) A3) A4) A5) A6) A7) A8) A9) A10) A11) A12) A13) A14) A15) A16) A17) A18) A19) A20) A21) APage8
Page 10 of 16
Elementary Statistics: Picturing the World, 6th Edition Test Bank - Page 10 preview image3Concepts1) Dataattheratiolevelaresimilartodataattheintervallevel,butwiththeaddedpropertythatazeroentryisaninherentzero(impliesʺnoneʺ).Also,fordataattheratiolevelaratiooftwodatavaluescanbeformedsothatonedatavaluecanbeexpressedasamultipleofanother.2) Suchdataisattheintervallevelratherthantheratiolevelbecausethetemperatureof0°Cdoesnotrepresentaconditionwherenoheatispresent,soitisnotaninherentzeroasrequiredbytheratiolevel.Also,ratiosoftwotemperaturescannotbeformedsothatonedatavalueisexpressedasamultipleoftheother.Thetemperature2°Cisnottwiceaswarmas1°C.1.3DataCollectionandExperimentalDesign1DecideWhetherStudyisObservationalStudyorExperiment1) A2) A3) A4) A5) A6) A7) Theexperimentalunitsarethe82adultsinthestudy.Thetreatmentisthenewdiabetesmedication.2IdentifyaBiasedSample1) Thestudymaybebiasedbecauseitislimitedtopeoplewithcomputers.2) Areportsponsoredbythecitrusindustryismuchmorelikelytoreachconclusionsfavorabletotheindustry.3) Thewordingofthequestionisbiased,asittendstoencouragenegativeresponses.3IdentifySamplingTechniques1) A2) A3) A4) A5) A6) A7) A8) A9) A10) A11) A12) A13) A14) A15) 163,169,15,92,9716) 163,487,693,169,51317) 16,34,69,38,1318) 1634,3890,1695,1392,150919) A4Concepts1) Instratifiedsampling,membersofthepopulationaredividedintotwoormoresubsets,orstrata,thatshareasimilarcharacteristic.Asampleisthenrandomlyselectedfromeachofthestrata.Astratifiedsamplehasmembersfromeachsegmentofthepopulation.Inclustersampling,thepopulationisdividedintonaturallyoccurringsubgroups,eachhavingsimilarcharacteristics.Allofthemembersinoneormore(butnotall)oftheclustersarethenselected.Inaclustersample,caremustbetakentoensurethatallclustershavesimilarcharacteristics.2) Acensusisacountormeasureofanentirepopulation,whileasamplingisacountormeasureofpartofapopulation.Acensusprovidescompleteinformationbutisoftenexpensive,difficult,andtimeconsumingtoperformespeciallyifthepopulationislarge.Asamplingislessexpensiveandtimeconsuming,howeverappropriatesamplingtechniquesmustbeusedtoensurethatunbiaseddataarecollectedandthatthesampleisrepresentativeofthepopulation.Evenwiththebestsamplingmethods,samplingerrorcanoccur.Page9
Page 11 of 16
Elementary Statistics: Picturing the World, 6th Edition Test Bank - Page 11 preview imageCh.2DescriptiveStatistics2.1FrequencyDistributionsandTheirGraphs1InterpretaFrequencyDistributionMULTIPLECHOICE.Choosetheonealternativethatbestcompletesthestatementoranswersthequestion.Usethegivenfrequencydistributiontofindthe(a)classwidth.(b)classmidpointsofthefirstclass.(c)classboundariesofthefirstclass.1)Height(ininches)ClassFrequency,f50-52553-55856-581259-611362-6411A) (a)3(b)51(c)49.5-52.5B) (a)2(b)51.5(c)49.5-52.5C) (a)3(b)51(c)50-52D) (a)2(b)51.5(c)50-522)PhoneCalls(perday)ClassFrequency,f8-111812-152316-193820-234724-2732A) (a)4(b)9.5(c)7.5-11.5B) (a)3(b)10.5(c)8-11C) (a)4(b)10.5(c)8-11D) (a)3(b)9.5(c)7.5-11.53)Weight(inpounds)ClassFrequency,f135-1396140-1444145-14911150-15415155-1598A) (a)5(b)137(c)134.5-139.5B) (a)5(b)137(c)135-139C) (a)4(b)137.5(c)134.5-139.5D) (a)4(b)137.5(c)135-139Page10
Page 12 of 16
Elementary Statistics: Picturing the World, 6th Edition Test Bank - Page 12 preview image4)Miles(perday)ClassFrequency,f1-293-4225-6287-8159-104A) (a)2(b)1.5(c)0.5-2.5B) (a)1(b)1.5(c)0.5-2.5C) (a)2(b)1(c)1-2D) (a)1(b)1(c)1-2SHORTANSWER.Writethewordorphrasethatbestcompleteseachstatementoranswersthequestion.Usethemaximumandminimumdataentriesandthenumberofclassestofindtheclasswidth,thelowerclasslimits,andtheupperclasslimits.5) min=1,max=30,6classes6) min=80,max=265,6classes2InterpretFrequencyDistributionGraphsMULTIPLECHOICE.Choosetheonealternativethatbestcompletesthestatementoranswersthequestion.Provideanappropriateresponse.1) Usetheogivebelowtoapproximatethenumberinthesample.A) 80B) 100C) 341D) 28Page11
Page 13 of 16
Elementary Statistics: Picturing the World, 6th Edition Test Bank - Page 13 preview image2) Usetheogivebelowtoapproximatethecumulativefrequencyfor24hours.A) 63B) 17C) 27D) 75SHORTANSWER.Writethewordorphrasethatbestcompleteseachstatementoranswersthequestion.Usetherelativefrequencyhistogramtoa)identifytheclasswiththegreatest,andtheclasswiththeleast,relativefrequency.b)approximatethegreatestandleastrelativefrequencies.c)approximatetherelativefrequencyofthefifthclass.3)Usethegivenfrequencydistributiontoconstructafrequencyhistogram,arelativefrequencyhistogramandafrequencypolygon.4)Height(ininches)ClassFrequency,f50-52553-55856-581259-611362-6411Page12
Page 14 of 16
Elementary Statistics: Picturing the World, 6th Edition Test Bank - Page 14 preview image5)Weight(inpounds)ClassFrequency,f135-1396140-1444145-14911150-15415155-1598Usethegivenfrequencydistributiontoconstructacumulativefrequencydistributionandanogive.6)PhoneCalls(perday)ClassFrequency,f8-111812-152316-193820-234724-27327)Height(ininches)ClassFrequency,f50-52553-55856-581259-611362-64118)Weight(inpounds)ClassFrequency,f135-1396140-1444145-14911150-15415155-15989)Miles(perday)ClassFrequency,f1-293-4225-6287-8159-1043ConstructaFrequencyDistributionfromDataSetMULTIPLECHOICE.Choosetheonealternativethatbestcompletesthestatementoranswersthequestion.Provideanappropriateresponse.1) AcityinthePacificNorthwestrecordeditshighesttemperatureat91 degreesFahrenheitanditslowesttemperatureat12degreesFahrenheitforaparticularyear.Usethisinformationtofindtheupperandlowerlimitsofthefirstclassifyouwishtoconstructafrequencydistributionwith10classes.A) 12-19B) 12-20C) 7-17D) 12-18Page13
Page 15 of 16
Elementary Statistics: Picturing the World, 6th Edition Test Bank - Page 15 preview image2) Asampleofcandieshaveweightsthatvaryfrom2.35gramsto4.75grams.Usethisinformationtofindtheupperandlowerlimitsofthefirstclassifyouwishtoconstructafrequencydistributionwith12classes.A) 2.35-2.55B) 2.35-2.54C) 2.35-2.65D) 2.35-2.75SHORTANSWER.Writethewordorphrasethatbestcompleteseachstatementoranswersthequestion.Thegradepointaveragesfor40studentsarelistedbelow.2.03.21.82.90.94.03.32.93.60.83.12.42.42.31.61.64.03.13.21.82.22.21.70.53.63.41.92.03.01.13.04.04.02.11.91.10.53.23.02.23)Constructafrequencydistribution,arelativefrequencydistribution,andacumulativefrequencydistributionusingeightclasses.Includethemidpointsoftheclasses.4) Constructafrequencyhistogram,arelativefrequencyhistogramandafrequencypolygonusingeightclasses.5) Constructanogiveusingeightclasses.Theheights(ininches)of30adultmalesarelistedbelow.7072717069736968707167717074696871717172697168677374707169686) Constructafrequencydistribution,arelativefrequencydistribution,andacumulativefrequencydistributionusingfiveclasses.7) Constructafrequencyhistogramusingfiveclasses.8) Constructarelativefrequencyhistogramusingfiveclasses.9) Constructafrequencypolygonusingfiveclasses.10) Constructaogiveusingfiveclasses.TheHighwayPatrol,usingradar,checkedthespeeds(inmph)of30passingmotoristsatacheckpoint.Theresultsarelistedbelow.44384150363643424948354037414350454539385041473635404243483311) Constructafrequencydistribution,arelativefrequencydistribution,andacumulativefrequencydistributionusingsixclasses.12) Constructafrequencyhistogram,arelativefrequencyhistogramandafrequencypolygonusingsixclasses.13) Constructanogiveusingsixclasses.Page14
Page 16 of 16
Elementary Statistics: Picturing the World, 6th Edition Test Bank - Page 16 preview imageProvideanappropriateresponse.14) ListedbelowaretheACTscoresof40randomlyselectedstudentsatamajoruniversity.18221315242420191912162514192123251818132626252519171815132119191424202123221917a)Constructarelativefrequencyhistogramofthedata,usingeightclasses.b)Iftheuniversitywantstoacceptthetop90%oftheapplicants,whatshouldtheminimumscorebe?c)Iftheuniversitysetstheminimumscoreat17,whatpercentoftheapplicantswillbeaccepted?4ConceptsSHORTANSWER.Writethewordorphrasethatbestcompleteseachstatementoranswersthequestion.Provideanappropriateresponse.1) Explainthedifferencebetweenclasslimitsandclassboundaries.2.2MoreGraphsandDisplays1InterpretDataSetsMULTIPLECHOICE.Choosetheonealternativethatbestcompletesthestatementoranswersthequestion.Matchthedescriptionofthesamplewiththecorrectplot.1) Time(inminutes)ittakesasampleofemployeestodrivetoworkA)B)C) Key:0 9=0.9012349493678015680D) Key:7 2=72678989023367824567780115SHORTANSWER.Writethewordorphrasethatbestcompleteseachstatementoranswersthequestion.Provideanappropriateresponse.2) ThenumbersofhomerunsthatSammySosahitinthefirst15yearsofhismajorleaguebaseballcareerarelistedbelow.Makeastem-and-leafplotforthisdata.Whatcanyouconcludeaboutthedata?41510833253640366663506449403) ThenumbersofhomerunsthatBarryBondshitinthefirst18yearsofhismajorleaguebaseballcareerarelistedbelow.Makeastem-and-leafplotforthisdata.Whatcanyouconcludeaboutthedata?162524193325344637334240373449734645Page15
Preview Mode

This document has 285 pages. Sign in to access the full document!