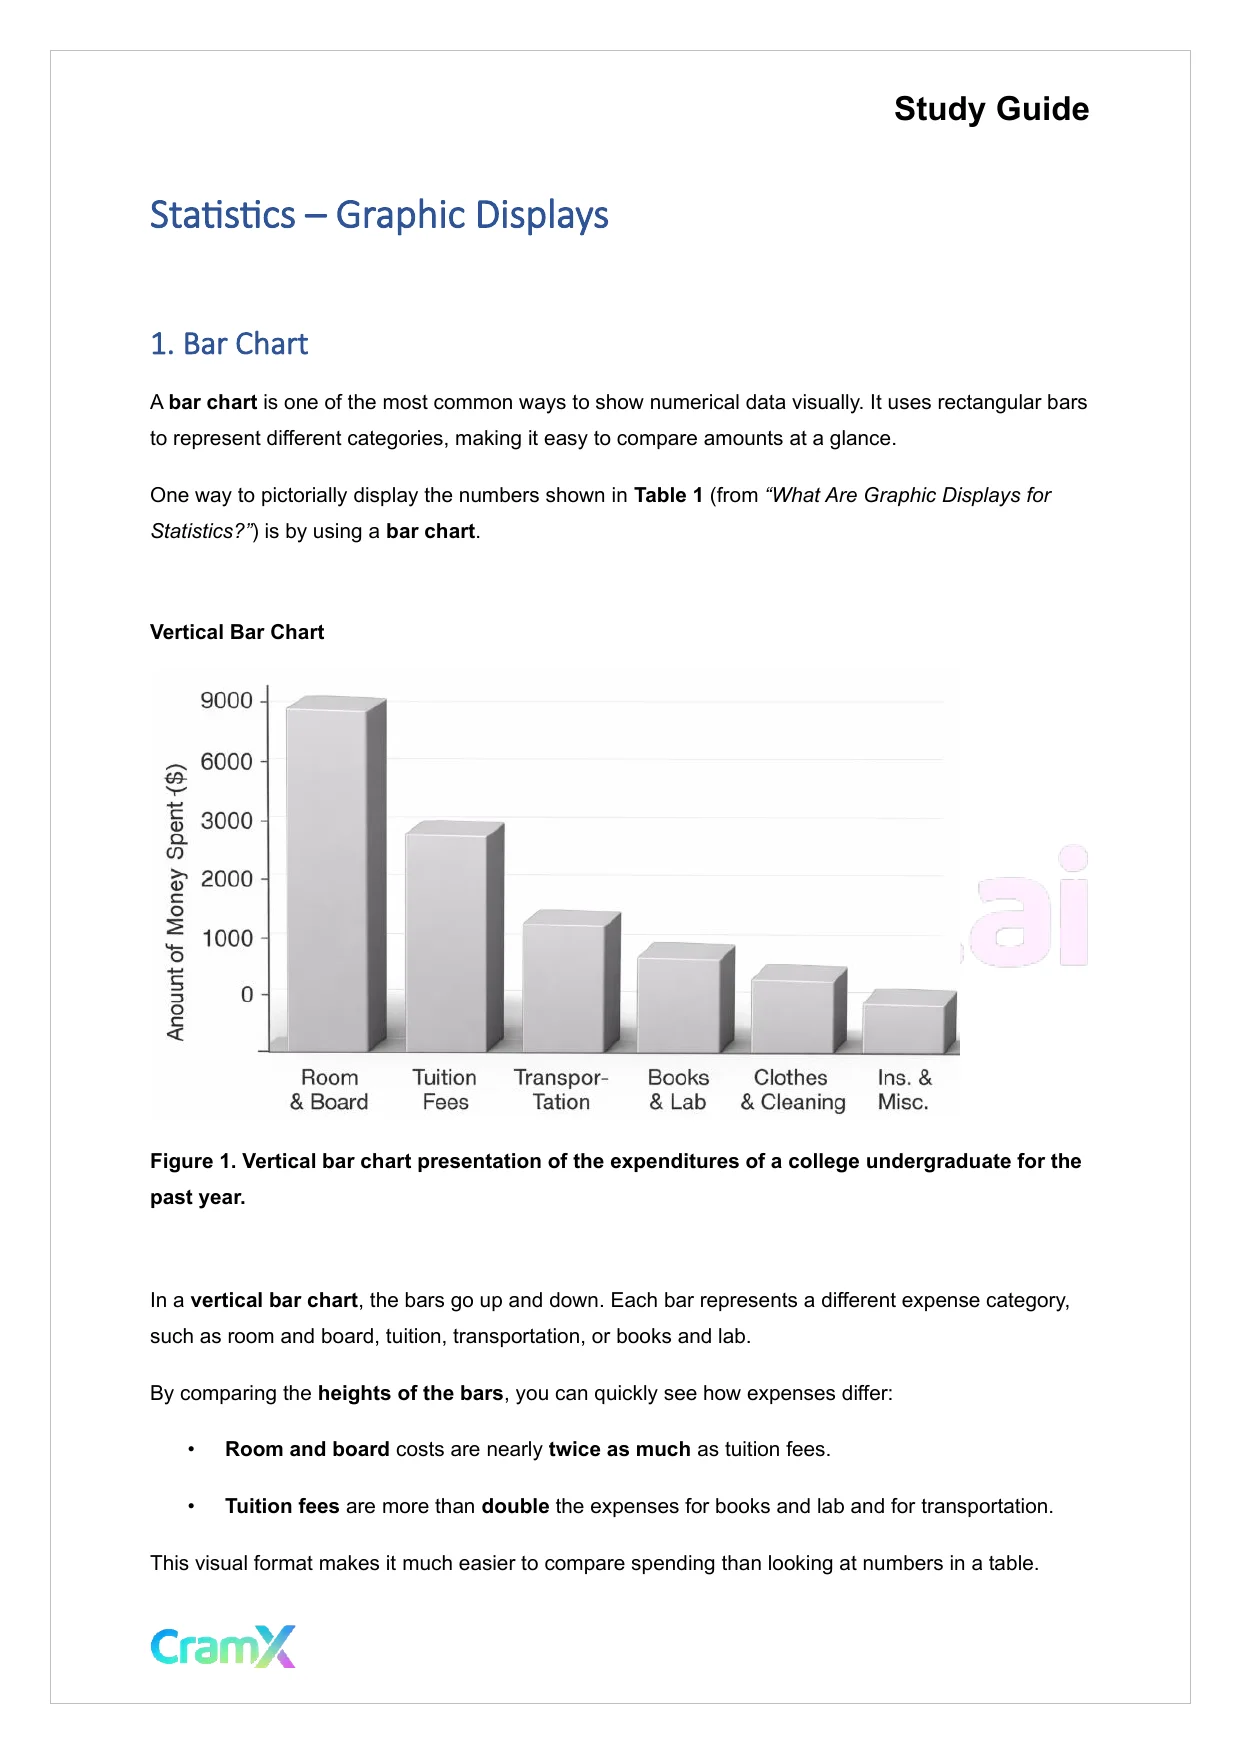
 Study GuideStatistics–Graphic Displays1.Bar ChartAbar chartis one of the most common ways to show numerical data visually. It uses rectangular barsto represent different categories, making it easy to compare amounts at a glance.One way to pictorially display the numbers shown inTable 1(from“What Are Graphic Displays forStatistics?”) is by using abar chart.Vertical Bar ChartFigure 1. Vertical bar chart presentation of the expenditures of a college undergraduate for thepast year.In avertical bar chart, the bars go up and down. Each bar represents a different expense category,such as room and board, tuition, transportation, or books and lab.By comparing theheights of the bars, you can quickly see how expenses differ:•Room and boardcosts are nearlytwice as muchas tuition fees.•Tuition feesare more thandoublethe expenses for books and lab and for transportation.This visual format makes it much easier to compare spending than looking at numbers in a table.
Preview Mode
This document has 53 pages. Sign in to access the full document!