

Statistics - Introduction to Statistics
- Statistics
- Texas A&M University
- 14 pages
- Shared March 2026
Preview 5 of 14 pages
See the first 5 pages exactly as they appear in the document.
Page 1 Read page 1 as text
Study Guide Statistics – Introduction to Statistics 1. Method of Statistical Inference Statistics is more than just numbers on a page. It is a method — a structured way of using numbers to answer interesting and sometimes difficult questions about the world around us. These questions can involve people, animals, nature, medicine, education, or society as a whole. Think about questions like these: • Which teaching method helps third - graders learn to read better? • Will a new medicine work better than the one already in use? • Is it likely to rain tomorrow? • What might happen in the next presidential election? • Which factory process makes fewer defective products? • How can pollsters predict election results by asking only a few thousand people instead of millions? All of these questions can be explored using statistics. 1.1 What Is Statistics? For our purposes, statistics has two main meanings : 1. A collection of information This includes numbers, tables, charts, graphs, and other visual displays that summarize data. 2. A process for making decisions Statistics is both an art and a science. It helps us make careful and reasonable guesses about outcomes when we do not have complete information. In everyday life, we rarely have all the data we want. Statistics gives us tools to work with what we do have — and still reach useful conclusions.
Page 2 Read page 2 as text
Study Guide 1.2 The Main Goals of Statistics At its core, statistics aims to do two important things: • Describe data clearly This means organizing and summarizing information so patterns and trends are easy to understand. • Make accurate inferences Using limited data, statistics helps us draw conclusions about larger groups or future outcomes. 2. Types of Statistics When we talk about descriptive statistics , we usually describe data in two main ways: 1. Using numbers 2. Using pictures or graphs Both methods help us understand data better, but they do so in different ways. 2.1 Numerical Statistics Numerical statistics are values expressed as numbers. However, not all numbers are equally useful on their own. What matters most is how those numbers summarize or represent the data. For example, imagine you are offered a deal where you can buy one car for $1 — but only if you also buy a second car. In this situation, the price of the second car becomes very important. If it costs $1,000, the deal sounds reasonable. But if it costs $1,00 0,000, the deal is no longer attractive. Instead of looking at just one number, you would want to consider the average (or mean) of the two prices. The mean gives a better overall picture of the cost and helps you make a smarter decision. This is why numerical statistics like averages are so useful — they summarize information in a meaningful way. 2.2 Pictorial Statistics Pictorial statistics take numerical data and display it visually using graphs or charts . Presenting data in pictures often makes it easier to understand, especially when the data set is large or complicated.
Page 3 Read page 3 as text
Study Guide A well - designed graph can: • Highlight patterns and trends • Make comparisons clearer • Turn confusing numbers into clear insights Different types of graphs are used depending on the type of data: • Quantitative data (numbers you can measure) use certain kinds of graphs • Categorical data (groups or categories) use others 3. Steps in the Statistical Process Making accurate predictions or conclusions does not happen by accident. It requires careful preparation and a clear process. To make an educated guess that is better than random chance , a statistician follows a set of important steps. Let’s look at these steps one by one. Step 1: Gather the Data The first step is to collect data , which means gathering numerical information related to the question being studied. This data might come from surveys, experiments, observations, or existing records. Good conclusions start with good data. Step 2: Organize the Data Once the data is collected, it needs to be organized . This might involve arranging numbers in tables, lists, or charts. Sometimes, the data is also shown visually using graphs or other pictorial displays. Organizing data makes patterns easier to spot and prepares it for analysis. Step 3: Analyze the Data Next comes analysis . In this step, statisticians use mathematical tools — such as averages, variability measures, and tests of significance — to study the data more deeply. This helps determine whether patterns are meaningful or just due to chance.
Page 4 Read page 4 as text
Study Guide Step 4: Draw an Inference After analyzing the data, the final step is to draw an inference . An inference is an informed statistical conclusion or prediction based on the data. It is not a wild guess — it is a reasoned decision supported by evidence. Why These Steps Matter At first glance, these steps may seem simple — and some of them are. However, doing them correctly is what makes statistics reliable. Each step must be performed in specific, careful ways. These methods are what give statistics its power and credibility. In fact, these procedures are the core of statistics . This book is designed to guide you through each step and show you how to use them together to solve real - world problems with confidence. 4. Making Predictions Imagine you plan to sell commemorative T - shirts at your town’s centennial picnic. You know there is a chance to make a good profit — but only if you sell most of the shirts . Your supplier will not take back any unsold shirts, so guessing wrong could leave you with a large pile of inventory and no profit. This leads to an important question: How many T - shirts should you buy? 4.1 Asking the Right Questions The first thing you need to know is how many people will attend the picnic. Suppose you learn that 100,000 tickets have already been sold. Now what? Should you buy: • 10,000 shirts? • 50,000 shirts? • 100,000 shirts? • Even more? You also need to think about sizes — small, medium, large, and extra - large. On top of that, you must ask yourself a key business question: How many shirts do I need to sell to make a profit and not be stuck with thousands of unsold ones?
Page 5 Read page 5 as text
Study Guide 4. 2 Why You Need a Sample Ideally, you would like to know exactly how many of those 100,000 ticket holders plan to buy a T - shirt — and which sizes they want. But asking every single person is not realistic. It would take too much time and money. Instead, you could ask a small group , such as 100 ticket holders. This smaller group is called a sample . If you find out how many people in the sample plan to buy a T - shirt, you can use that information to estimate how many people in the full group — the population — might do the same. 4. 3 Sample vs. Population • The population is the entire group you are interested in (all 100,000 ticket holders). • The sample is the smaller group you actually collect data from (the 100 people you ask). For your prediction to work well, the sample must be representative , meaning it should be similar to the population in important ways. 4. 4 Making a Prediction Suppose that out of your sample of 100 people, 50 say they would happily pay $10 for a centennial T - shirt . If your sample truly represents the population, it would be reasonable to expect that about 50% of the 100,000 ticket holders — or 50,000 people — might buy a shirt. If you earn a profit of just $1 per shirt , that adds up to $50,000 in profit . Not bad! 4. 5 Why Caution Is Important Before you start dreaming about spending your profits, there is an important warning. Your prediction depends heavily on how representative your sample really is. What if: • You accidentally asked people who have more spending money? • You talked mostly to souvenir lovers? • Your sample does not reflect the full range of picnic attendees? If the sample is not representative, your prediction could be very wrong — and you might end up with thousands of unsold T - shirts instead of a profit.
9 more pages in the full document
Unlock it once and it stays in your library, ready to chat with or turn into flashcards.
Unlock the full documentMore Statistics study materials
See all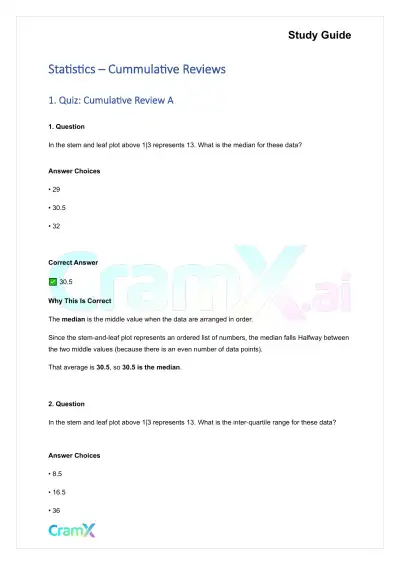 Quick Guides
Statistics - Cummulative Reviews
Statistics
58 pagesMar 2026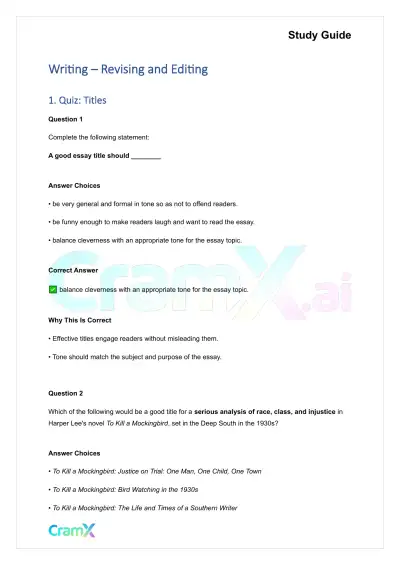 Quick Guides
Writing - Revising and Editing
English
16 pagesMar 2026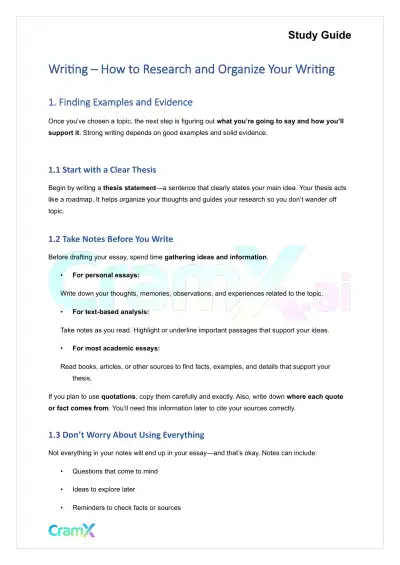 Quick Guides
Writing - How to Research and Organize Your Writing
English
21 pagesMar 2026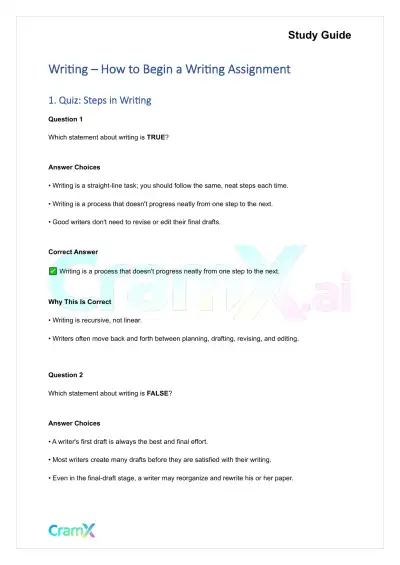 Quick Guides
Writing - How to Begin a Writing Assignment
English
30 pagesMar 2026 Quick Guides
Writing - Writing From Introduction to Conclusion
English
33 pagesMar 2026 Quick Guides
Statistics - Principles of Testing
Statistics
58 pagesMar 2026 Quick Guides
Statistics - Probability
Statistics
68 pagesMar 2026 Quick Guides
Statistics - Graphic Displays
Statistics
53 pagesMar 2026
Study this document with CramX
Once it is in your library, every tool can work from it.