

Statistics - Bivariate Relationships
- Statistics
- Texas A&M University
- 65 pages
- Shared March 2026
Preview 10 of 65 pages
See the first 10 pages exactly as they appear in the document.
Page 1 Read page 1 as text
Study Guide Statistics – Bivariate Relationships 1. Quiz: Simple Linear Regression 1. Question The coefficients of the least squares regression line are determined by minimizing the sum of the squares of the: Answer Choices • x - coordinates • y - coordinates • residuals Correct Answer residuals Why This Is Correct Least squares regression chooses the line that makes the vertical errors (residuals) as small as possible overall by minimizing the sum of squared residuals . 2. Question A residual is computed as: Answer Choices • a y - coordinate from the data minus a y - coordinate predicted by the line • a y - coordinate predicted by the line minus a y - coordinate from the data • an x - coordinate from the data minus an x - coordinate predicted by the line
Page 2 Read page 2 as text
Study Guide Correct Answer a y - coordinate from the data minus a y - coordinate predicted by the line Why This Is Correct Residual = observed − predicted : 3. Question A geometric interpretation of a residual is the: Answer Choices • perpendicular distance from a data point to the regression line • horizontal distance from a data point to the regression line • vertical distance from a data point to the regression line Correct Answer vertical distance from a data point to the regression line Why This Is Correct In regression, residuals measure the vertical difference between the actual point and the regression line. 4. Question A paired data set has (n = 5), ( ∑ x = 15), ( ∑ y = 27), ( ∑ xy = 100), and ( ∑ x 2 = 55). (S xy =) Answer Choices • 1.9 • 10 • 19
Page 3 Read page 3 as text
Study Guide Correct Answer 19 Why This Is Correct 5. Question A paired data set has (n = 5), ( ∑ x = 15), ( ∑ y = 27), ( ∑ xy = 100), and ( ∑ x 2 = 55). (S xx =) Answer Choices • 1.9 • 10 • 19 Correct Answer 10 Why This Is Correct 6. Question A paired data set has (n = 5), ( ∑ x = 15), ( ∑ y = 27), ( ∑ xy = 100), and ( ∑ x 2 = 55). The slope of the regression line is:
Page 4 Read page 4 as text
Study Guide Answer Choices • 1.9 • 10 • 19 Correct Answer 1.9 Why This Is Correct Slope: 7. Question A paired data set has (n = 5), ( ∑ x = 15), ( ∑ y = 27), ( ∑ xy = 100), and ( ∑ x 2 = 55). The intercept of the regression line is: Answer Choices • – 0.3 • 1.9 • 5.4 Correct Answer – 0.3 Why This Is Correct First find the means:
Page 5 Read page 5 as text
Study Guide Intercept: 8. Question A paired data set has ( x̄ = 10), ( ȳ = 8), and slope of the regression line (1.5). The intercept of the regression line is: Answer Choices • – 7 • 8 • 23 Correct Answer – 7 Why This Is Correct Intercept formula: 9. Question A set of paired data has (s x = 2.4), (s y = 3.2), and correlation coefficient (r = - 0.8). The slope of the regression line is:
Page 6 Read page 6 as text
Study Guide Answer Choices • – 1.067 • – 0.8 • – 0.6 Correct Answer – 1.067 Why This Is Correct Slope formula using correlation: Rounded: – 1.067 10. Question The equation of the regression line is ( ŷ = 1.2x - 3.4). Predict (y) when (x = 5). Answer Choices • 1.6 • 2.6 • 8.0 Correct Answer 2.6 Why This Is Correct
Page 7 Read page 7 as text
Study Guide Substitute (x = 5): 11. Question The equation of the regression line is ( ŷ = 1.2x - 3.4). Compute the residual for the point ((7,6)). Answer Choices • – 1 • 1 • 5 Correct Answer 1 Why This Is Correct First find the predicted value when (x = 7): Residual = observed − predicted: 12. Question A set of paired data has ( x̄ = 8.0, s x = 4.9, ȳ = 26.0, s y = 13.2,) and (r = 0.97). The slope of the least squares regression line is: Answer Choices • 0.36 • 0.97 • 2.62
Page 8 Read page 8 as text
Study Guide Correct Answer 2.62 Why This Is Correct Slope formula: Rounded to the nearest choice: 2.62 13. Question A set of paired data has ( x̄ = 8.0, s x = 4.9, ȳ = 26.0, s y = 13.2,) and (r = 0.97). The y - intercept of the least squares regression line is: Answer Choices • 5.1 • 8.0 • 13.2 Correct Answer 5.1 Why This Is Correct Intercept formula: Using (b 1 ≈ 2.62):
Page 9 Read page 9 as text
Study Guide 14. Question A set of paired data has ( x̄ = 8.0, s x = 4.9, ȳ = 26.0, s y = 13.2,) and (r = 0.97). Which point is on the least squares regression line? Answer Choices • (0, 0.97) • (4.9, 13.2) • (8.0, 26.0) Correct Answer (8.0, 26.0) Why This Is Correct The least squares regression line always passes through the point: (( x̄ , ȳ )) So the correct point is ((8.0, 26.0)). 15. Question A point estimate for the slope of least squares regression line for all pairs in the population is: Answer Choices • the correlation coefficient for the pairs in the sample • the slope of the regression line for the pairs in the sample • the sum of the squares of the residuals for the regression line for the pairs in the sample Correct Answer the slope of the regression line for the pairs in the sample
Page 10 Read page 10 as text
Study Guide Why This Is Correct The sample regression slope (b 1 ) is used as the point estimate for the population slope ( β 1 ). 16. Question If a confidence interval for the slope of the least squares regression line for all pairs in the population has a negative lower bound and a positive upper bound , then: Answer Choices • there is evidence of a positive linear association between the variables • there is evidence of a negative linear association between the variables • there is no evidence of a linear association between the variables Correct Answer there is no evidence of a linear association between the variables Why This Is Correct If the confidence interval includes 0 , then the slope could be 0. So we cannot conclude there is a significant linear relationship. 17. Question If a confidence interval for the slope of the least squares regression line for all pairs in the population has a positive lower bound and a positive upper bound , then: Answer Choices • there is evidence of a positive linear association between the variables • there is evidence of a negative linear association between the variables • there is no evidence of a linear association between the variables
55 more pages in the full document
Unlock it once and it stays in your library, ready to chat with or turn into flashcards.
Unlock the full documentMore Statistics study materials
See all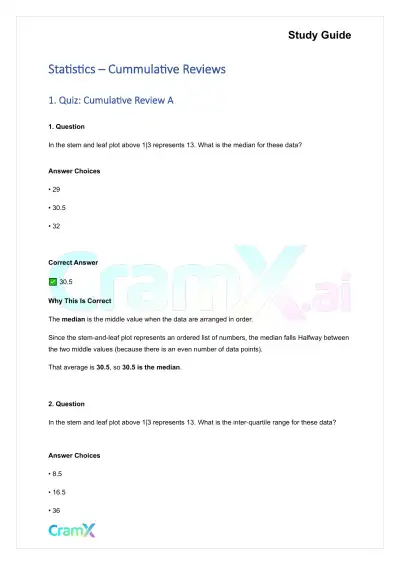 Quick Guides
Statistics - Cummulative Reviews
Statistics
58 pagesMar 2026 Quick Guides
Writing - Revising and Editing
English
16 pagesMar 2026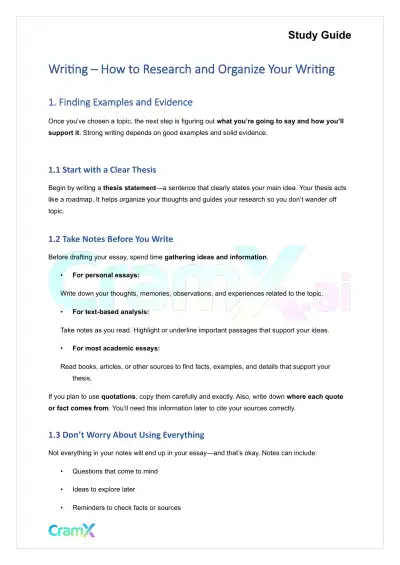 Quick Guides
Writing - How to Research and Organize Your Writing
English
21 pagesMar 2026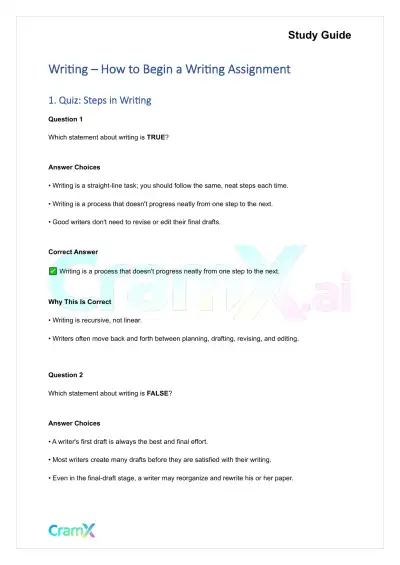 Quick Guides
Writing - How to Begin a Writing Assignment
English
30 pagesMar 2026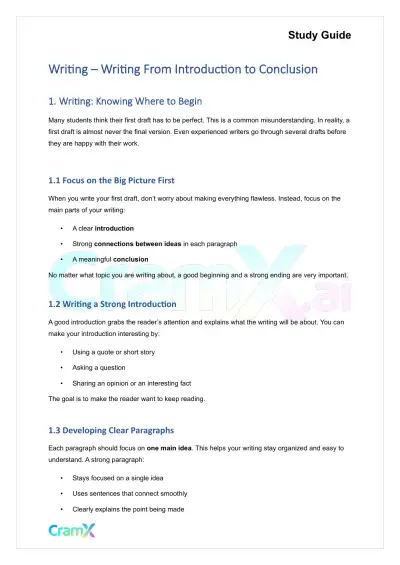 Quick Guides
Writing - Writing From Introduction to Conclusion
English
33 pagesMar 2026 Quick Guides
Statistics - Principles of Testing
Statistics
58 pagesMar 2026 Quick Guides
Statistics - Probability
Statistics
68 pagesMar 2026 Quick Guides
Statistics - Graphic Displays
Statistics
53 pagesMar 2026
Study this document with CramX
Once it is in your library, every tool can work from it.