

Statistics - Common Mistakes and Tables
- Statistics
- Texas A&M University
- 25 pages
- Shared March 2026
Preview 8 of 25 pages
See the first 8 pages exactly as they appear in the document.
Page 1 Read page 1 as text
Study Guide Statistics – Common Mistakes and Tables 1. Common Mistakes Statistics can feel tricky because there are many ways to make small mistakes. But here’s the good news: most exam errors come from a short list of common oversights. If you learn to watch out for these, you can greatly improve your accuracy and confidence. 1. Mixing Up Standard Deviation and Variance A very common mistake is forgetting whether a formula needs standard deviation or variance . • Standard deviation: ( σ ) or (s) • Variance: ( σ 2 ) or (s 2 ) Quick rule: • To get variance , square the standard deviation • To get standard deviation , take the positive square root of the variance 2. Confusing One - Tailed and Two - Tailed Hypotheses Choosing the wrong type of test can throw off your entire hypothesis test. Use a one - tailed test when: • The hypothesis says one value is greater than another • Example: “Scores will be higher after training.” Use a two - tailed test when: • The hypothesis says values will be different , but doesn’t specify the direction • Example: “Scores will be different after training.” (could be higher or lower) Important reminder: Your null hypothesis and alternative hypothesis must cover all possibilities :
Page 2 Read page 2 as text
Study Guide • greater than (>) • less than (<) • equal to (=) 3. Forgetting to Split Alpha in a Two - Tailed Test If a test is two - tailed , you must split your significance level (( α )) into two equal parts. Example: • If ( α = 0.05), then each tail gets: That means you look up critical values using 0.025 , not 0.05 . Also remember: Alpha is always split when computing confidence intervals. 4. Misreading the Standard Normal (z) Table Not all z - tables show probabilities the same way, so it’s easy to read the wrong area. For example: • Some tables show the area at or below z • Some show the area between the mean and z In this case: Table 2 in Statistics Tables gives the area at or below z . So if you need the area to the right of z , use:
Page 3 Read page 3 as text
Study Guide 5. Using the Wrong Degrees of Freedom in a One - Sample t - Test When working with a one - sample t - test , your degrees of freedom are: Always subtract 1 from (n) before using the t - table. 6. Mixing Up Confidence Level and Confidence Interval These sound similar, but they mean different things. Confidence level = how confident you are (like 95%) It relates to the significance level and chance results. Confidence interval = the range of values where the true parameter may fall It goes from a low value to a high value based on the confidence level. 7. Confusing Interval Width and Margin of Error A confidence interval is always: The margin of error is the “plus or minus” part. The interval width is double the margin of error. Example: If a parameter is estimated as 46% ± 4% : • Margin of error = 4% • Interval width = 8% 8. Confusing Statistics with Parameters This mistake happens a lot because the symbols look similar.
Page 4 Read page 4 as text
Study Guide Parameters describe the population (usually unknown) • Use Greek letters like: o ( μ ) ( population mean) o ( σ ) ( population standard deviation) Statistics describe a sample (you can calculate them) • Examples: o ( x̄ ) (sample mean) o (s) (sample standard deviation) Key idea: You compute statistics to estimate parameters , but they are not interchangeable . 9. Confusing the Addition Rule and the Multiplication Rule These probability rules are used in different situations. Multiplication rule : use when all favorable outcomes must happen Example: You need event A and event B. Addition rule : use when at least one success must happen Example: You need event A or event B. 10. Forgetting That the Addition Rule Requires Mutually Exclusive Outcomes The addition rule works differently depending on whether outcomes can happen together. If outcomes are mutually exclusive , they cannot happen at the same time . Then you can just add probabilities. But if outcomes can occur together , you must subtract the overlap:
Page 5 Read page 5 as text
Study Guide 11. Forgetting to Average the Two Middle Values for an Even Median If your data set has an even number of values , the median is NOT one value — it’s the average of the two middle values. Steps: 1. Put the data in order 2. Find the two middle values 3. Take their mean This rule also matters sometimes when finding quartiles . 12. Placing Frequency Polygon Points in the Wrong Spot A frequency polygon should not use class interval endpoints. The points belong at the center (midpoint) of each class interval. Not at the edges — always at the middle . Quick Final Tip Most statistics mistakes happen because of small details like symbols, table values, tails, or formulas. If you slow down and double - check these common points, your work becomes much more reliable — and your exam scores can improve fast. 2. Statistics Tables Statistics tables can look super intimidating at first — lots of numbers, small print, and strange labels. But don’t worry: once you understand what each table is for and how to read it , they become one of the easiest tools to use on exams. This section includes four important tables: Table 1: Binomial Probabilities (for (n ≤ 20)) Table 2: Standard Normal (z) Probabilities
Page 6 Read page 6 as text
Study Guide Table 3: t Distribution Critical Values Table 4: Chi - Square (( χ 2 )) Critical Values
Page 7 Read page 7 as text
Study Guide
Page 8 Read page 8 as text
Study Guide
17 more pages in the full document
Unlock it once and it stays in your library, ready to chat with or turn into flashcards.
Unlock the full documentMore Statistics study materials
See all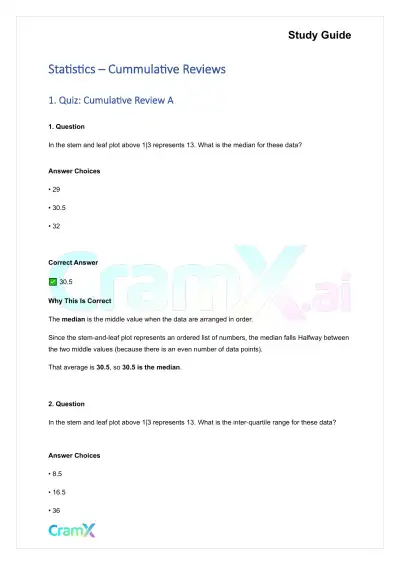 Quick Guides
Statistics - Cummulative Reviews
Statistics
58 pagesMar 2026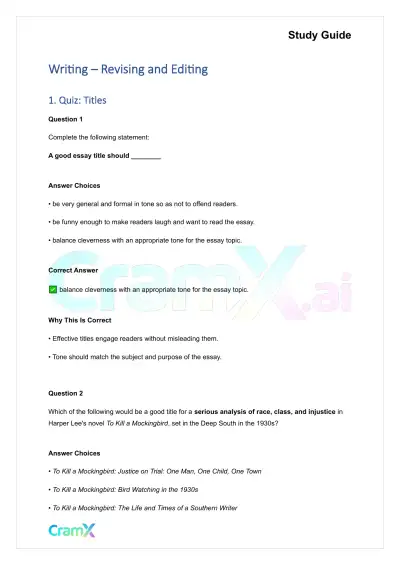 Quick Guides
Writing - Revising and Editing
English
16 pagesMar 2026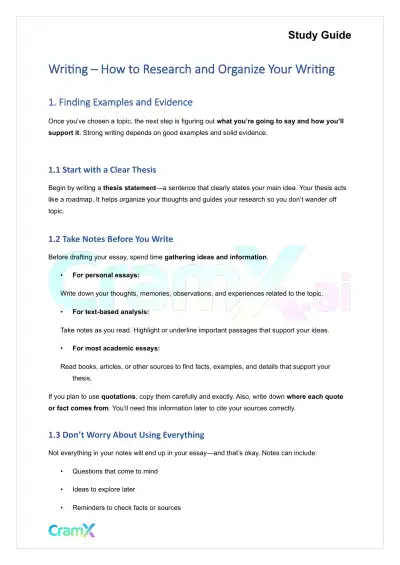 Quick Guides
Writing - How to Research and Organize Your Writing
English
21 pagesMar 2026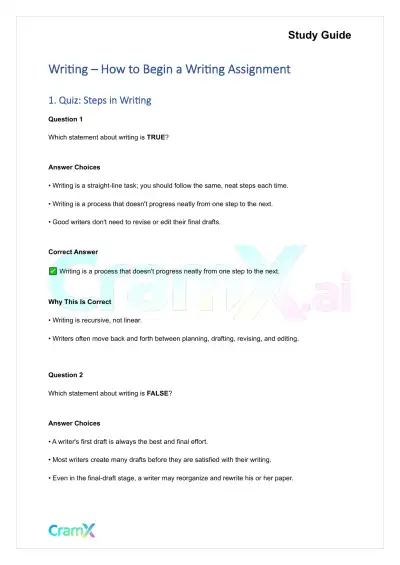 Quick Guides
Writing - How to Begin a Writing Assignment
English
30 pagesMar 2026 Quick Guides
Writing - Writing From Introduction to Conclusion
English
33 pagesMar 2026 Quick Guides
Statistics - Principles of Testing
Statistics
58 pagesMar 2026 Quick Guides
Statistics - Probability
Statistics
68 pagesMar 2026 Quick Guides
Statistics - Graphic Displays
Statistics
53 pagesMar 2026
Study this document with CramX
Once it is in your library, every tool can work from it.