

Accounting Principles II – Cost-Volume-Profit Relationships
- Accounting
- Texas A&M University
- 20 pages
- Shared March 2026
Preview 6 of 20 pages
See the first 6 pages exactly as they appear in the document.
Page 1 Read page 1 as text
Study Guide Accounting Principles II – Cost - Volume - Profit Relationships 1. Cost Behavior Cost behavior explains how a cost changes when the level of activity changes. Activity can mean units produced, units sold, hours worked, or services provided. Some costs stay the same , while others increase or decrease as activity changes. Understanding cost behavior helps managers: • Prepare budgets • Make forecasts • Estimate profits • Choose between different business options 1. Fixed Costs Fixed costs remain the same in total , no matter how many units are produced or sold. • The total fixed cost does not change • The fixed cost per unit changes as activity changes For example, if production increases, the fixed cost is spread over more units, so the cost per unit decreases . Example of a Fixed Cost Straight - line depreciation is a fixed cost.
Page 2 Read page 2 as text
Study Guide A machine may be used to produce 1,000 units or 10,000,000 units in a month, but the depreciation expense stays the same because it depends on time , not usage. 2. Variable Costs Variable costs change in total when activity changes. • The cost per unit stays the same • The total cost increases or decreases with activity Example of a Variable Cost Direct materials are a variable cost. If: • One chair requires 1 yard of fabric • Fabric costs $5 per yard Then: • 1 chair costs $5
Page 3 Read page 3 as text
Study Guide • 10 chairs cost $50 • 100 chairs cost $500 The cost per unit stays at $5, but the total cost rises as more chairs are made. Comparing Fixed and Variable Costs Graphically When shown on a graph: • Total fixed costs appear as a flat horizontal line • Total variable costs slope upward as activity increases
Page 4 Read page 4 as text
Study Guide 3. Mixed Costs Mixed costs contain both fixed and variable components . Example of a Mixed Cost A phone plan charges: • $1,000 for the first 800 calls • $0.10 per call after 800 calls If a company makes 2,000 calls in March: • Extra calls = 1,200 • Extra cost = 1,200 × $0.10 = $120 • Total cost = $1,120 Because mixed costs behave like both fixed and variable costs, they must be separated into two parts before analysis.
Page 5 Read page 5 as text
Study Guide 4. Methods Used to Analyze Mixed Costs To separate mixed costs, companies use past data and the following methods: Scatter Diagram Method A scatter diagram plots: • Activity on the horizontal (x) axis • Cost on the vertical (y) axis Each dot represents one observation. A line is drawn through the points to estimate the cost pattern. • Where the line meets the vertical axis = fixed cost • The slope of the line = variable cost per unit Example
Page 6 Read page 6 as text
Study Guide Using two data points: • 36,000 gallons → $14,000 • 60,000 gallons → $20,000 Change in cost = $6,000 Change in activity = 24,000 gallons Variable cost per unit = $0.25 Estimated fixed cost = $5,000 High – Low Method The high – low method uses only: • The highest activity level • The lowest activity level
14 more pages in the full document
Unlock it once and it stays in your library, ready to chat with or turn into flashcards.
Unlock the full documentMore Accounting study materials
See all Quick Guides
Accounting Principles II – Current Liabilities
Accounting
15 pagesMar 2026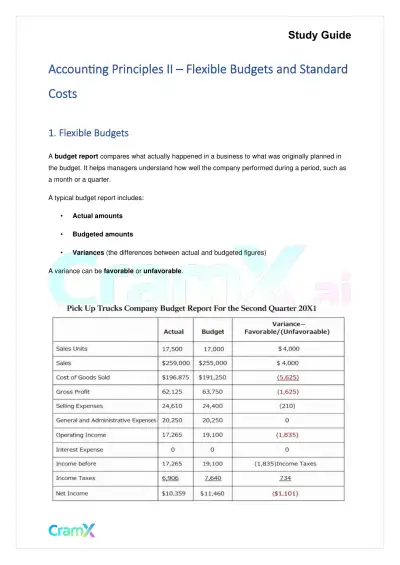 Quick Guides
Accounting Principles II – Flexible Budgets and Standard Costs
Accounting
23 pagesMar 2026 Quick Guides
Accounting Principles II – Activity-Based Costing
Accounting
13 pagesMar 2026 Quick Guides
Accounting Principles II – Traditional Cost Systems
Accounting
31 pagesMar 2026 Quick Guides
Accounting Principles II – Capital Budgeting
Accounting
13 pagesMar 2026 Quick Guides
Accounting Principles II – Managerial and Cost Accounting Concepts
Accounting
20 pagesMar 2026 Quick Guides
Accounting Principles II – Partnerships
Accounting
23 pagesMar 2026 Quick Guides
Accounting Principles II – Investments
Accounting
19 pagesMar 2026
Study this document with CramX
Once it is in your library, every tool can work from it.