Solution Manual For Elementary Statistics, 3rd Edition

Unlock the answers to every textbook problem with Solution Manual For Elementary Statistics, 3rd Edition, making studying more efficient and effective.

Jackson Roberts
Contributor
4.7
32
10 months ago
Preview (16 of 314 Pages)
100%
Log in to unlock

Page 1

Solution Manual For Elementary Statistics, 3rd Edition - Page 1 preview image

Loading page ...

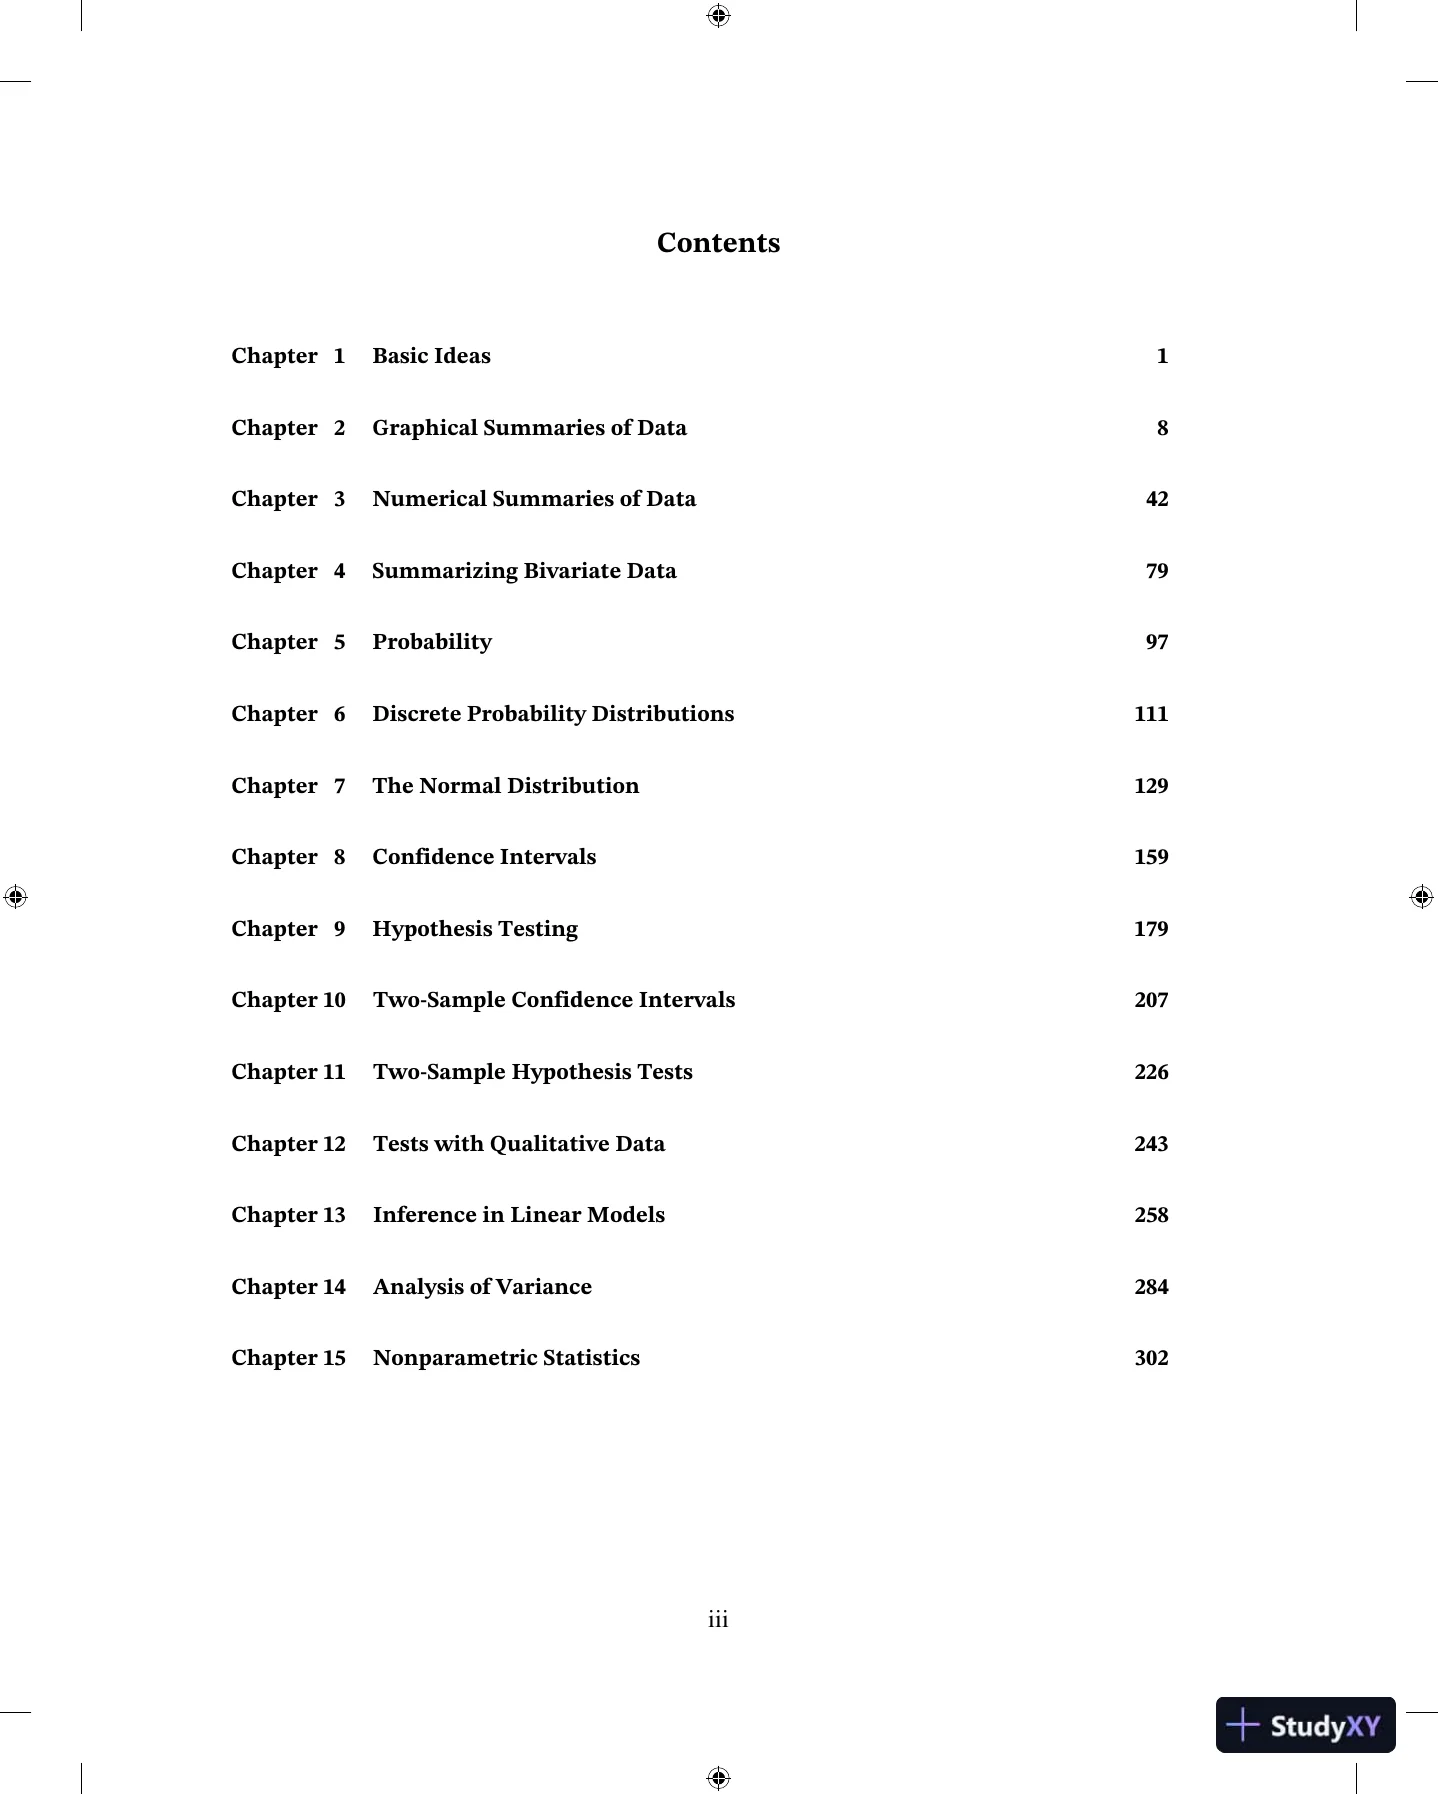
iiiContentsChapter1Basic Ideas1Chapter2Graphical Summaries of Data8Chapter3Numerical Summaries of DataChapter4Summarizing Bivariate Data79Chapter5Probability97Chapter6Discrete Probability Distributions111Chapter7The Normal Distribution129Chapter8Confidence Intervals159Chapter9Hypothesis Testing179Chapter 10Two-Sample Confidence Intervals207Chapter 11Two-Sample Hypothesis Tests226Chapter 12Tests with Qualitative Data243Chapter 13Inference in Linear Models258Chapter 14Analysis of Variance284Chapter 15Nonparametric Statistics30242

Page 2

Solution Manual For Elementary Statistics, 3rd Edition - Page 2 preview image

Loading page ...

Page 3

Solution Manual For Elementary Statistics, 3rd Edition - Page 3 preview image

Loading page ...

Chapter 1: Basic IdeasSection 1.1Exercises 1 – 6 are the Check YourUnderstanding exercises for this section.Answers to these exercises are on page 12of the text book.Understanding the Concepts7.population8.sample9.simple random sample10.sample of convenience11.cluster12.stratified13.False. In some cases it is difficult orimpossible to draw a sample in a trulyrandom way. In these cases, the best onecan do is to sample items by someconvenient method. A sample ofconvenience is one way.14.False. In a stratified sample, thepopulation is divided into groups, and arandom sample from each group is drawn.15.True16.TruePracticing the Skills17.Statistic18.Parameter19.Parameter20.Statistic21.Answers will vary.22.Answers will vary. Stratified sample23.Answers will vary. Cluster sample24.Answers will vary. Systematic sample25.Stratified sample26.Sample of convenience27.Cluster sample28.Systematic sample29.Voluntary response sample30.Cluster sample31.Sample of convenience32.Simple random sample33.Stratified sample34.Cluster sample35.Simple random sample36.Stratified sample37.Systematic sample38.Voluntary response sampleWorking with the Concepts39.It will be necessary to draw a sample ofconvenience. There is no list of allheadache sufferers from which to draw asimple random sample.40.It is feasible to draw a simple randomsample of students from a list of allstudents enrolled.41.Answers will vary. A simple randomsample could be drawn from a list of allregistered voters in the town.42.Answers will vary. A systematic samplecould be used in which every tenth itemwas sampled.43.Answers will vary. A stratified sample,consisting of simple random samples of100 men and 100 women, could be drawn.44.Answers will vary. A simple randomsample of tax forms could be drawn.Extending the Concepts45.Answers will vary.

Page 4

Solution Manual For Elementary Statistics, 3rd Edition - Page 4 preview image

Loading page ...

46.Let’s say we will sample everykth item.This determinesk− 1 clusters; the firstcluster consists of items 1,k+ 1, 2k+ 1, …;the second cluster consists of items 2,k+2, 2k+ 2, …; and so on. Choosing asystematic sample is like choosing one ofthese clusters at random.Section 1.2Exercises 1 – 4 are the Check YourUnderstanding exercises for this section.Answers to these exercises are on page 18.Understanding the Concepts5.variables6.qualitative7.Quantitative8.nominal; ordinal9.discrete10.Continuous11.False. Quantitative variables describe howmuch or how many of something there is.12.True13.True14.TruePracticing the Skills15.Qualitative16.Quantitative17.Quantitative18.Qualitative19.Quantitative20.Quantitative21.Qualitative22.Qualitative23.Qualitative24.Quantitative25.Ordinal26.Nominal27.Ordinal28.Ordinal29.Nominal30.Nominal31.Nominal32.Ordinal33.Continuous34.Continuous35.Discrete36.Discrete37.Continuous38.Discrete39.Discrete40.ContinuousWorking with the Concepts41.Ordinal42.Discrete43.Ordinal44.Quantitative45.Nominal46.Ordinal47. (A)Game Title, System(B)Release Year, Copies Sold(C)System(D)Game Title48. (A)Movie Title, Genre(B)ReleaseYear, Ticket Sales, RunningTime(C)Genre(D)Movie Title

Page 5

Solution Manual For Elementary Statistics, 3rd Edition - Page 5 preview image

Loading page ...

Extending the Concepts49. (A)Ordinal(B)Yes, it reflects a more favorableopinion of the construction of a newshopping mall.(C)No, we cannot say that Jason’sopinion is twice as favorable.(D)Quantitative(E)Yes, Brenda’s answer reflects theownership of more cars, andspecifically, the ownership of twice asmany cars.(F)Nominal(G)No, Brenda’s answer reflects neithermore of something nor twice as muchof something.Section 1.3Exercises 1 – 4 are the Check YourUnderstanding exercises for this section.Answers to these exercises are on page 26.Understanding the Concepts5.randomized6.double-blind7.observational8.confounder9.prospective10.cohort11.True12.False. A confounder makes it harder todraw conclusions from a study.13.False. In a randomized experiment,subjects are assigned to treatment groupsat random.14.False. Randomized experiments aregenerally more reliable than observationalstudies.15.True16.TruePracticing the Skills17. (A)Randomized experiment(B)Yes, because the assignment totreatments is made at random, there isno systematic difference between thegroups other than the drug taken thatcan explain the difference in painrelief.18. (A)Observational study(B)No, because this is an observationalstudy, the results may be due toconfounding. For example, those inthe low-exercise group may be olderand have higher blood pressure as aresult of age.19. (A)Randomized experiment(B)Yes, because the assignment totreatments is made at random, there isno systematic difference between thegroups other than the amount ofexercise that can explain thedifference in blood pressure.20. (A)The four types of fertilizer(B )Randomized experiment(C)Yes, because the assignment totreatment is made at random.

Page 6

Solution Manual For Elementary Statistics, 3rd Edition - Page 6 preview image

Loading page ...

Working with the Concepts21.An observational study will be necessary,because one can’t assign people to live inareas with high pollution levels.22.A randomized experiment is possible, withcold sufferers being assigned randomly tothe old or new drug.23.The result may be due to confounding.Areas with denser populations may haveboth more crime and more taxicabs.24.The result could be due to confounding.For example, more older people may livein larger houses than younger people, andalso have less chance of recovering from aheart attack.25. (A)False(B)True26.Children with larger vocabularies tend tobe older, and thus taller.27. (A)Heart rate(B)Maternal smoking(C)Cohort(D)Prospective(E)Yes. The level of prenatal care maydiffer between smoking andnonsmoking mothers.28. (A)Whether respiratory problems wereexperienced(B)The level of formaldehyde in theclassroom(C)A cohort study(D)Cross-sectional(E)It is unlikely. For confounding to bean issue, children with more sensitiverespiratory systems would have tohave been more likely to be assignedto classrooms with higher exposure.Extending the Concepts29. (A)Yes, because the subjects wererandomly assigned to treatment.(B)If a doctor knew whether a child hadreceived the vaccine, it mightinfluence the diagnosis.(C)It could be due to confounding. Thechildren who received the placebowere more likely to be middle- orupper-income than those who did notparticipate, and this may be the reasonthat the rate of polio was higher.30. (A)No(B)No(C)The treatment group consisted ofchildren who had consent toparticipate; middle- and upper-incomechildren were overrepresented in thisgroup. Therefore, the children in thetreatment group tended to be moresusceptible to polio than those in thecontrol group.31.Smokers who quit are less healthy thansmokers who don’t. Upon quittingsmoking, many people put on weightsubstituting food for tobacco.32.Smokers tend to drink more alcohol onthe average than non-smokers.Section 1.4Exercises 1 and 2 are the Check YourUnderstanding exercises for this section.Answers to these exercises are on page 30.

Page 7

Solution Manual For Elementary Statistics, 3rd Edition - Page 7 preview image

Loading page ...

Understanding the Concepts3.Voluntary response surveys4.nonresponders5.population6.False. The way that a question is wordedin a survey may have a large effect on theresponses.7.True8.False. A large sample size does not makeup for bias in questioning.Practicing the Skills9.Nonresponse bias10.Voluntary response bias11.Self-interest bias12.Self-interest bias13.Voluntary response bias14.Social acceptability bias15.Nonresponse bias16.Social acceptability biasWorking with the Concepts17. (A)No(B)No. Both questions are leading. Thefirst question leads to a ‘‘yes’’response, and the second leads to a‘‘no’’ response.18.Yes. People may be less likely to answerthe phone when they don’t recognize thenumber that is calling them.19.Yes. People who do not have landlinephones may tend to have differentopinions on some issues than people whodo have landline phones.20.Yes, people may be more likely to pick thefirst choice.Extending the Concepts21. (A)The poll oversampled higher-incomepeople.(B)The response rate was low — only23%. This results in nonresponse bias.(C)A sample that is not drawn by a validmethod can produce misleadingresults, even when it is large.CHAPTER 1 Quiz1.Answers will vary.2.Qualitative3.True4.Continuous5.False. Ideally a sample should representthe population as much as possible.6.Stratified sample7.acceptable8.Sample of convenience9.True10.Observational study11.Randomized experiment12.differences in treatment13.Seniors may be more likely to have betterpreparation for the class than sophomores.14.True15.Not reliable. This is a voluntary responsesurvey, so the people who respond tend tohold stronger opinions than others.CHAPTER 1 Review Exercises1.Quantitative2.Nominal

Page 8

Solution Manual For Elementary Statistics, 3rd Edition - Page 8 preview image

Loading page ...

3.Continuous4.(A)True(B)True(C)False5.Stratified sample6.Voluntary response sample7.Cluster sample8.Simple random sample9.(A)Observational study(B)Yes. People who live in areas withfluoridated water may have differentdental habits than those who live inareas without fluoridated water.10. (A)Randomized experiment(B)Because this is a randomizedexperiment, the results are unlikely tobe due to confounding.11. (A)Observational study(B)Yes. People who talk on cell phoneswhile driving may be more careless ingeneral than those who do not.12. (A)Randomized experiment(B)Because this is a randomizedexperiment, the results are unlikely tobe due to confounding.13.The sample is a voluntary responsesample.14.Nonresponse bias; living people are notincluded. People who are still alive are notincluded in the sample.15.There is a considerable level ofnonresponse bias.Write About It1.In both cluster sampling and stratifiedsampling, the population is divided intogroups. In stratified sampling, a simplerandom sample is chosen from eachgroup. In cluster sampling, a randomsample of groups is chosen, and everymember of the chosen groups is sampled.2.A potential problem with samples ofconvenience is that they may differsystematically in some way from thepopulation. For this reason, samples ofconvenience should not be used, except insituations where it is not feasible to draw arandom sample. When it is necessary todraw a sample of convenience, it isimportant to think carefully about all theways in which the sample might differsystematically from the population. If it isreasonable to believe that no importantsystematic difference exists, then it may beacceptable to use a sample of convenience.3.Answer will vary.4.Answers will vary.5.Some qualitative variables may benumeric when the number represents alabel. Examples include numbers on afootball jersey or on a racecar.6.A randomized experiment is a study inwhich the investigator assigns thetreatments to the experimental units atrandom. An observational studyis one inwhich the assignment to treatment groupsis not made by the investigator. The mainadvantage to conducting a randomizedexperiment is that if there are largedifferences in outcomes among thetreatment groups, we may conclude thatthe differences are due to the treatments.7.The main advantage to conducting adouble-blind study is that it is an impartialexperiment which eliminates the potential

Page 9

Solution Manual For Elementary Statistics, 3rd Edition - Page 9 preview image

Loading page ...

for bias from the investigator or thesubject. There are various limitations. Adouble-blind experiment requires a thirdparty to be involved in the experiment.Also, there may be factors that mayinfluence the outcome that are not knownwhen the experiment is double-blinded.8.Answers will vary.9. (A)This is an example of leading questionbias. It highly encourages a “yes” responsebecause of the phrase “or continue theirwasteful spending.” A more appropriatequestion would be “What is your opinionof Americans saving more money?Choices: Strongly disagree, Somewhatdisagree, Neither agree nor disagree,Somewhat agree, Strongly agree.’’(B)This is an example of leading questionbias. It highly encourages a “yes” responsebecause of the word “reputable.” A moreappropriate question would be “What isyour opinion of the current level offunding for charities?”CHAPTER 1 Case Study1.4502.413.41450=9.1%4.435.26.243=4.7%7.Yes, 9.1% is considerably larger than 4.7%.8.The high-exposure people and the school-return people are the same people.9.The low-exposure people and the mail-return people are the same people.10.People who respond by mail will beresponding during a period of lower PM.11.People with symptoms may tend torespond earlier; therefore, people withsymptoms are more likely to be school-return people.12.There would be no tendency for peoplewith symptoms to respond earlier.

Page 10

Solution Manual For Elementary Statistics, 3rd Edition - Page 10 preview image

Loading page ...

Chapter 2: Graphical Summaries of DataSection 2.1 ExercisesExercises 1 – 4 are the Check YourUnderstanding exercises located withinthe section. Their answers are found onpages 48 and 49.Understanding the Concepts5.frequency6.relative frequency7.Pareto chart8.pie chart9.False. In a frequency distribution, the sumof all frequencies equals the total numberof observations.10.True11.True12.False. In bar graphs and Pareto charts, theheights of the bars represent thefrequencies or relative frequencies.Practicing the Skills13. (A)Meat, poultry, fish, and eggs(B)False ($450 < $550)(C)True ($1300 > $1000)14. (A)Type O(B)False (7046.7%150=)(C)True15. (A)(B)(C)Everyone (E)(D)False(E)True (12.5% < 20%)16. (A)(B)(C)Medicare and Medicaid(D)68.8% (27.7% + 25.1% + 9.6% +6.4%)17. (A)West, South(B)Northeast, Midwest(C)True(D)False (the Northeast had around18%)

Page 11

Solution Manual For Elementary Statistics, 3rd Edition - Page 11 preview image

Loading page ...

18. (A)The game(B)True(C)False (men < women)(D)True (both are about 0.65)19. (A)(B)(C)(D)True20. (A)(B)(C)(D)True,7.20.32422.2=21. (A)

Page 12

Solution Manual For Elementary Statistics, 3rd Edition - Page 12 preview image

Loading page ...

(B)(C)(D)(E)(F)False. 28.9% < 50%.22. (A)(B)(C)(D)(E)(F)True. 53.4% > 50%.

Page 13

Solution Manual For Elementary Statistics, 3rd Edition - Page 13 preview image

Loading page ...

23. (A)(B)(C)(D)(E)(F)True. (3800 > 3134)24. (A)(B)(C)(D)

Page 14

Solution Manual For Elementary Statistics, 3rd Edition - Page 14 preview image

Loading page ...

(E)(F)True. 62.1% > 50%(G)False. 10.8% < 10.9%25. (A)(B)(C)(D)(E)True. (56.1% > 50%)(F)True. 43.9% are females(G)0.28926. (A)(B)

Page 15

Solution Manual For Elementary Statistics, 3rd Edition - Page 15 preview image

Loading page ...

(C)(D)(E)True. (64.5% > 50%)(F)0.10627. (A)(B)(C)(D)(E)True. 30.5% never back up theirdata.(F)False. 54.2% > 50%.28. (A)(B)

Page 16

Solution Manual For Elementary Statistics, 3rd Edition - Page 16 preview image

Loading page ...

(C)(D)(E)(F)0.13229. (A)(B)(C)(D)(E)0.21030. (A)(B)
Preview Mode

This document has 314 pages. Sign in to access the full document!