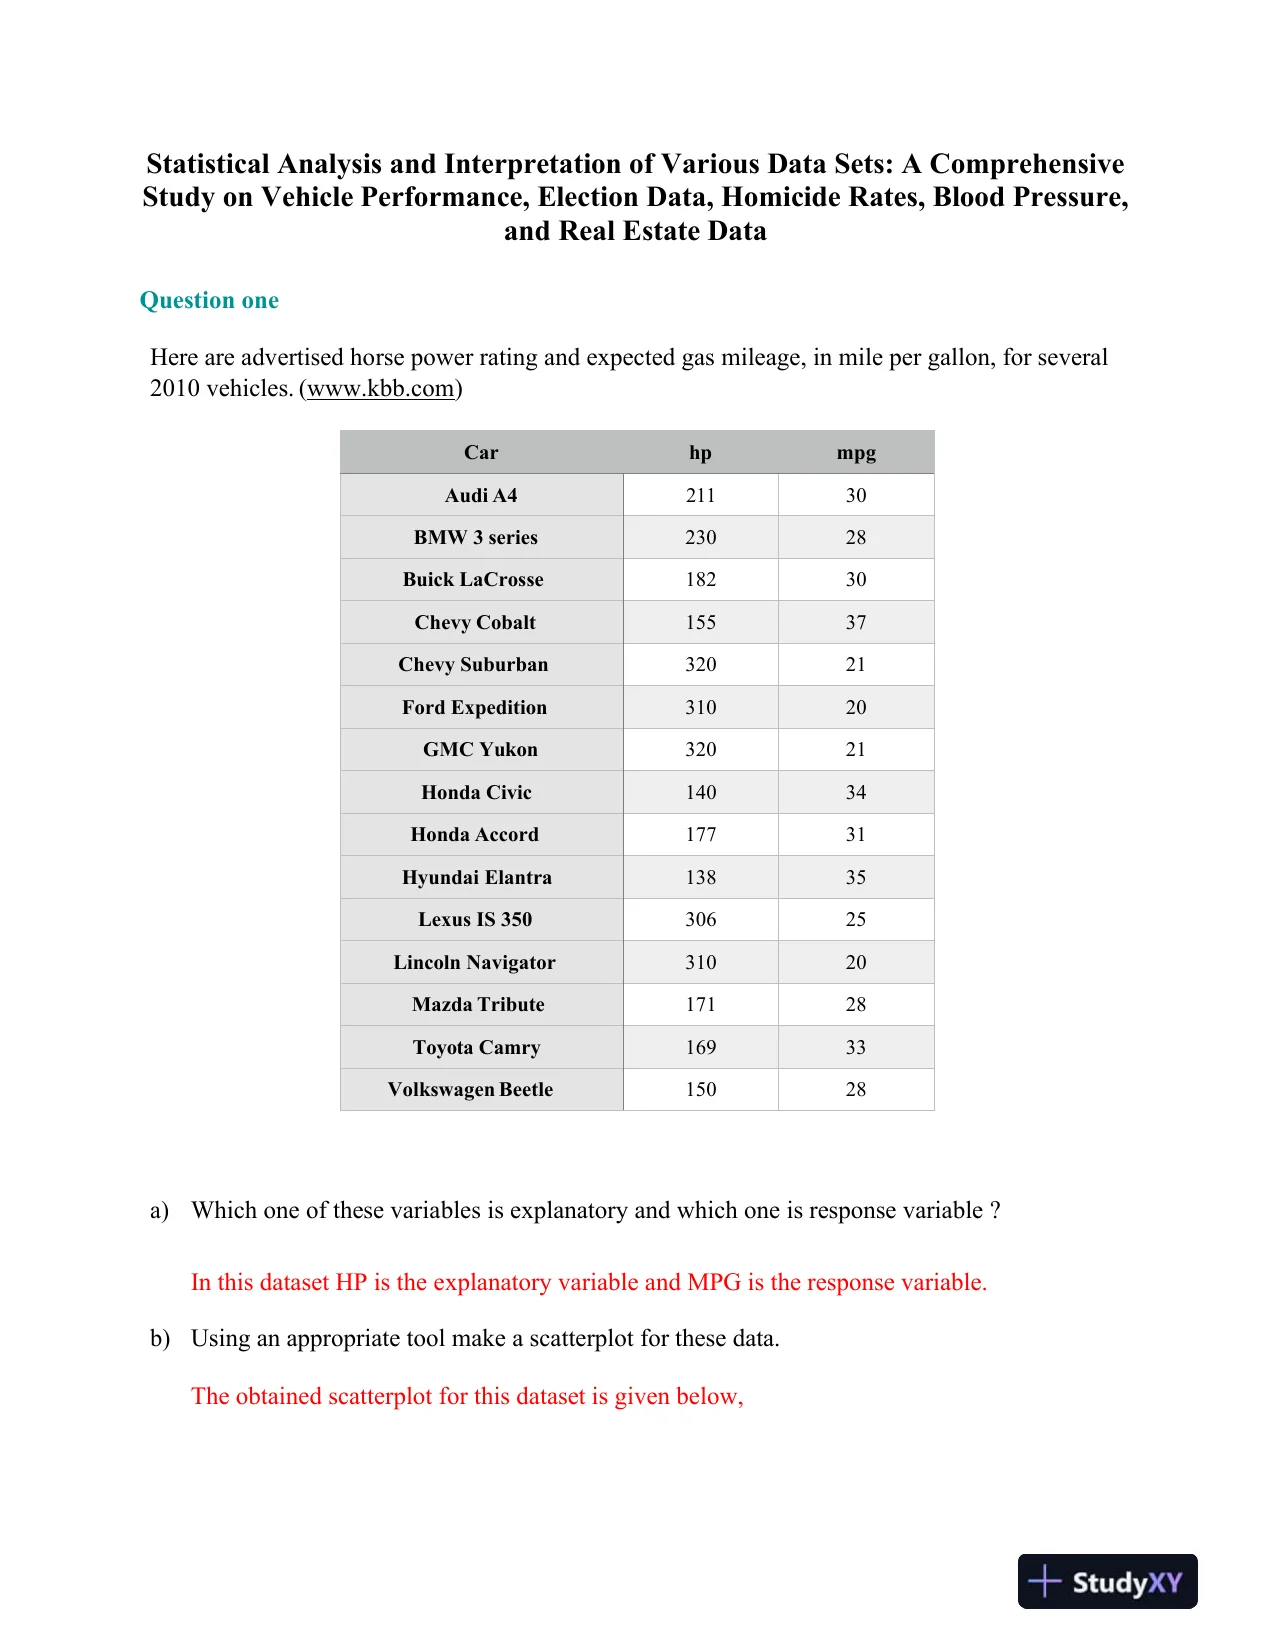
 Statistical Analysis and Interpretation of Various Data Sets: A ComprehensiveStudy on Vehicle Performance, Election Data, Homicide Rates, Blood Pressure,and Real Estate DataQuestion oneHere are advertised horse power rating and expected gasmileage, in mile per gallon, forseveral2010 vehicles.(www.kbb.com)CarhpmpgAudiA421130BMW 3series23028BuickLaCrosse18230ChevyCobalt15537ChevySuburban32021FordExpedition31020GMCYukon32021HondaCivic14034HondaAccord17731HyundaiElantra13835Lexus IS35030625LincolnNavigator31020MazdaTribute17128ToyotaCamry16933VolkswagenBeetle15028a)Which one of these variables is explanatory and which one is response variable?Inthis dataset HP is the explanatory variable and MPG is the response variable.b)Using an appropriate tool make a scatterplot for thesedata.The obtained scatterplot for this dataset is given below,
Preview Mode
This document has 10 pages. Sign in to access the full document!