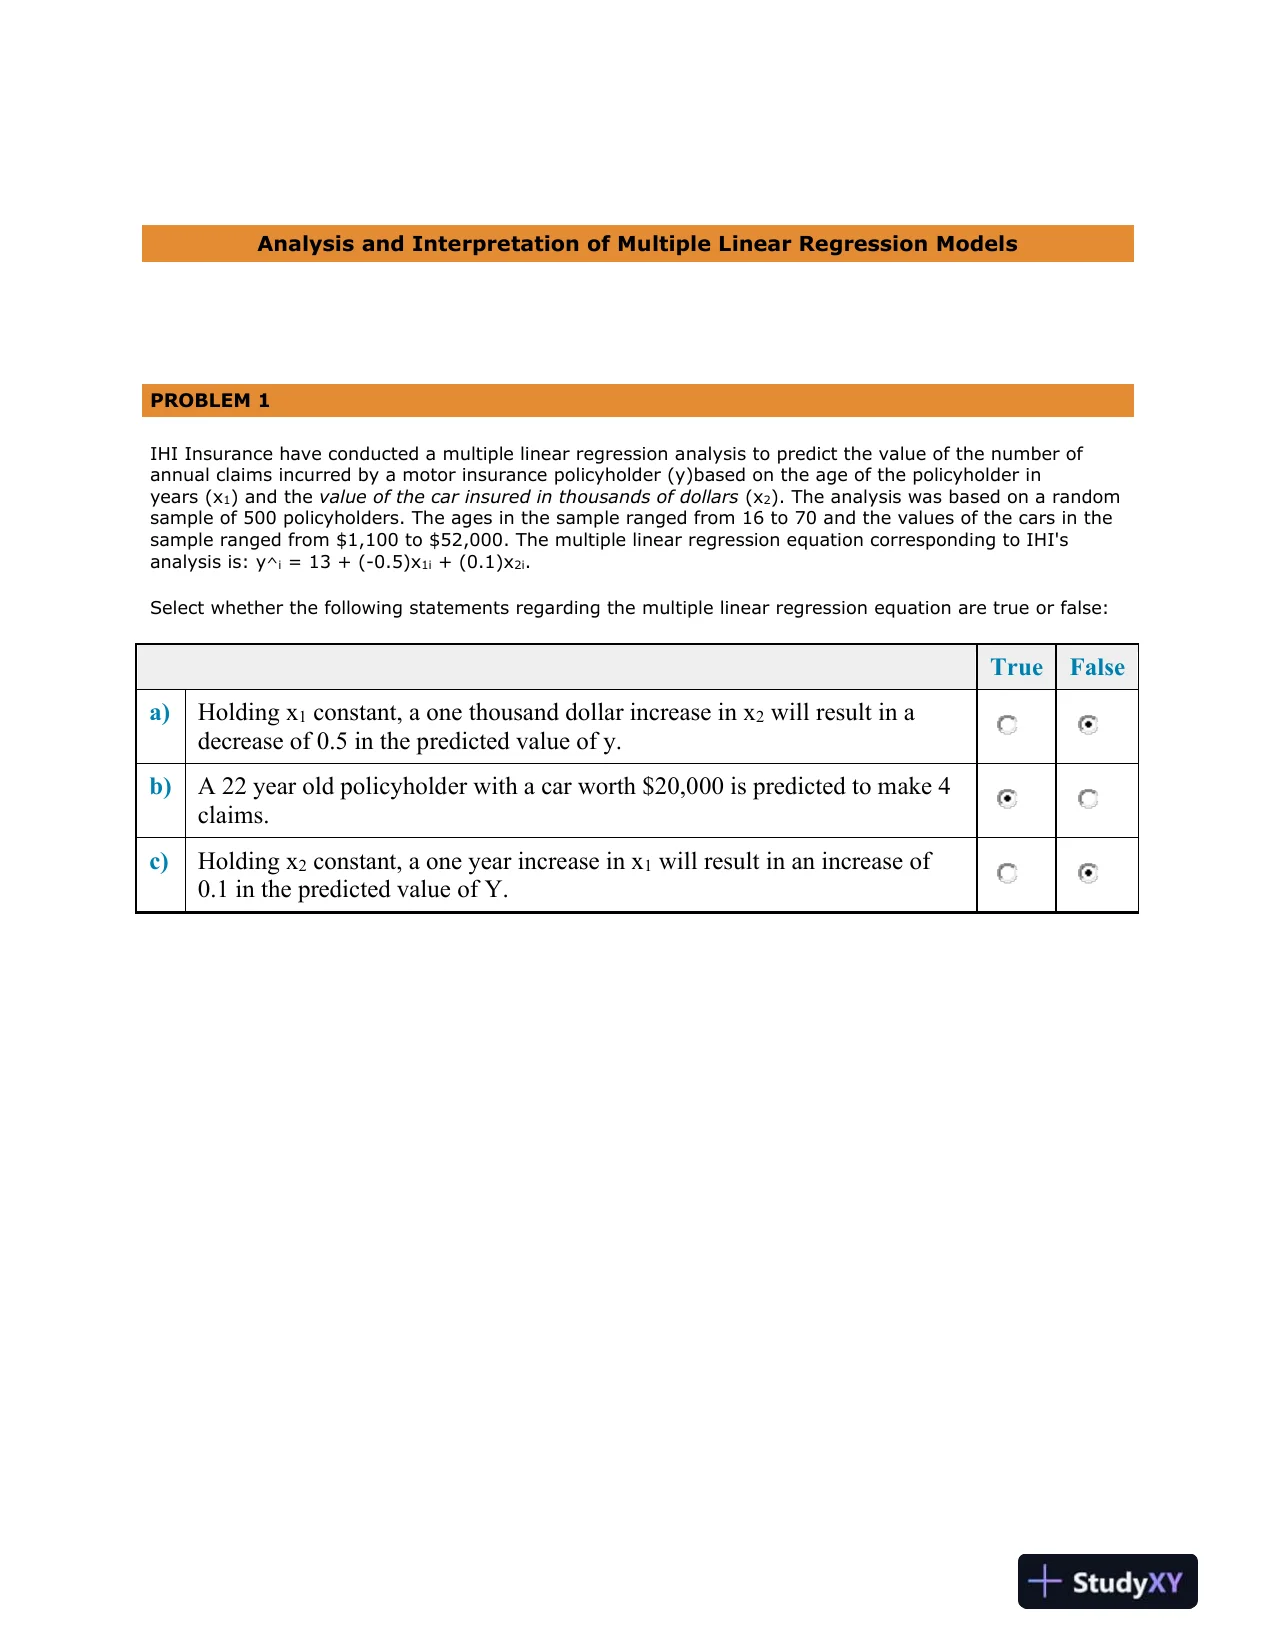
 Analysis and Interpretation of Multiple Linear Regression ModelsPROBLEM 1IHI Insurance have conducted a multiple linear regression analysis to predict the value of the number ofannual claims incurred by a motor insurancepolicyholder(y)based on the age of the policyholder inyears(x1)and thevalue of the car insured in thousands of dollars(x2). The analysis was based on a randomsample of 500 policyholders. The ages in the sample ranged from 16 to 70 and the values of the cars in thesample ranged from $1,100 to $52,000. The multiple linear regression equation corresponding to IHI'sanalysis is:y^i= 13 + (-0.5)x1i+ (0.1)x2i.Select whether the following statements regarding the multiple linear regressionequation are true or false:TrueFalsea)Holding x1constant, a one thousand dollar increase in x2will result in adecrease of 0.5 in the predicted value of y.b)A 22 year old policyholder with a car worth $20,000 is predicted to make 4claims.c)Holding x2constant, a one year increase in x1will result in an increase of0.1 in the predicted value of Y.
Preview Mode
This document has 8 pages. Sign in to access the full document!