CramX Logo
Analysis of Regression Models and Residual Diagnostics in Various Real-World Applications - Document preview page 1

Analysis of Regression Models and Residual Diagnostics in Various Real-World Applications - Page 1

Document preview content for Analysis of Regression Models and Residual Diagnostics in Various Real-World Applications

Analysis of Regression Models and Residual Diagnostics in Various Real-World Applications

Study on regression models and diagnostic techniques in statistics.

Chloe Martinez
Contributor
4.5
0
12 months ago
Preview (5 of 16 Pages)
100%
Log in to unlock
Page 1 of 5
Analysis of Regression Models and Residual Diagnostics in Various Real-World Applications - Page 1 preview image
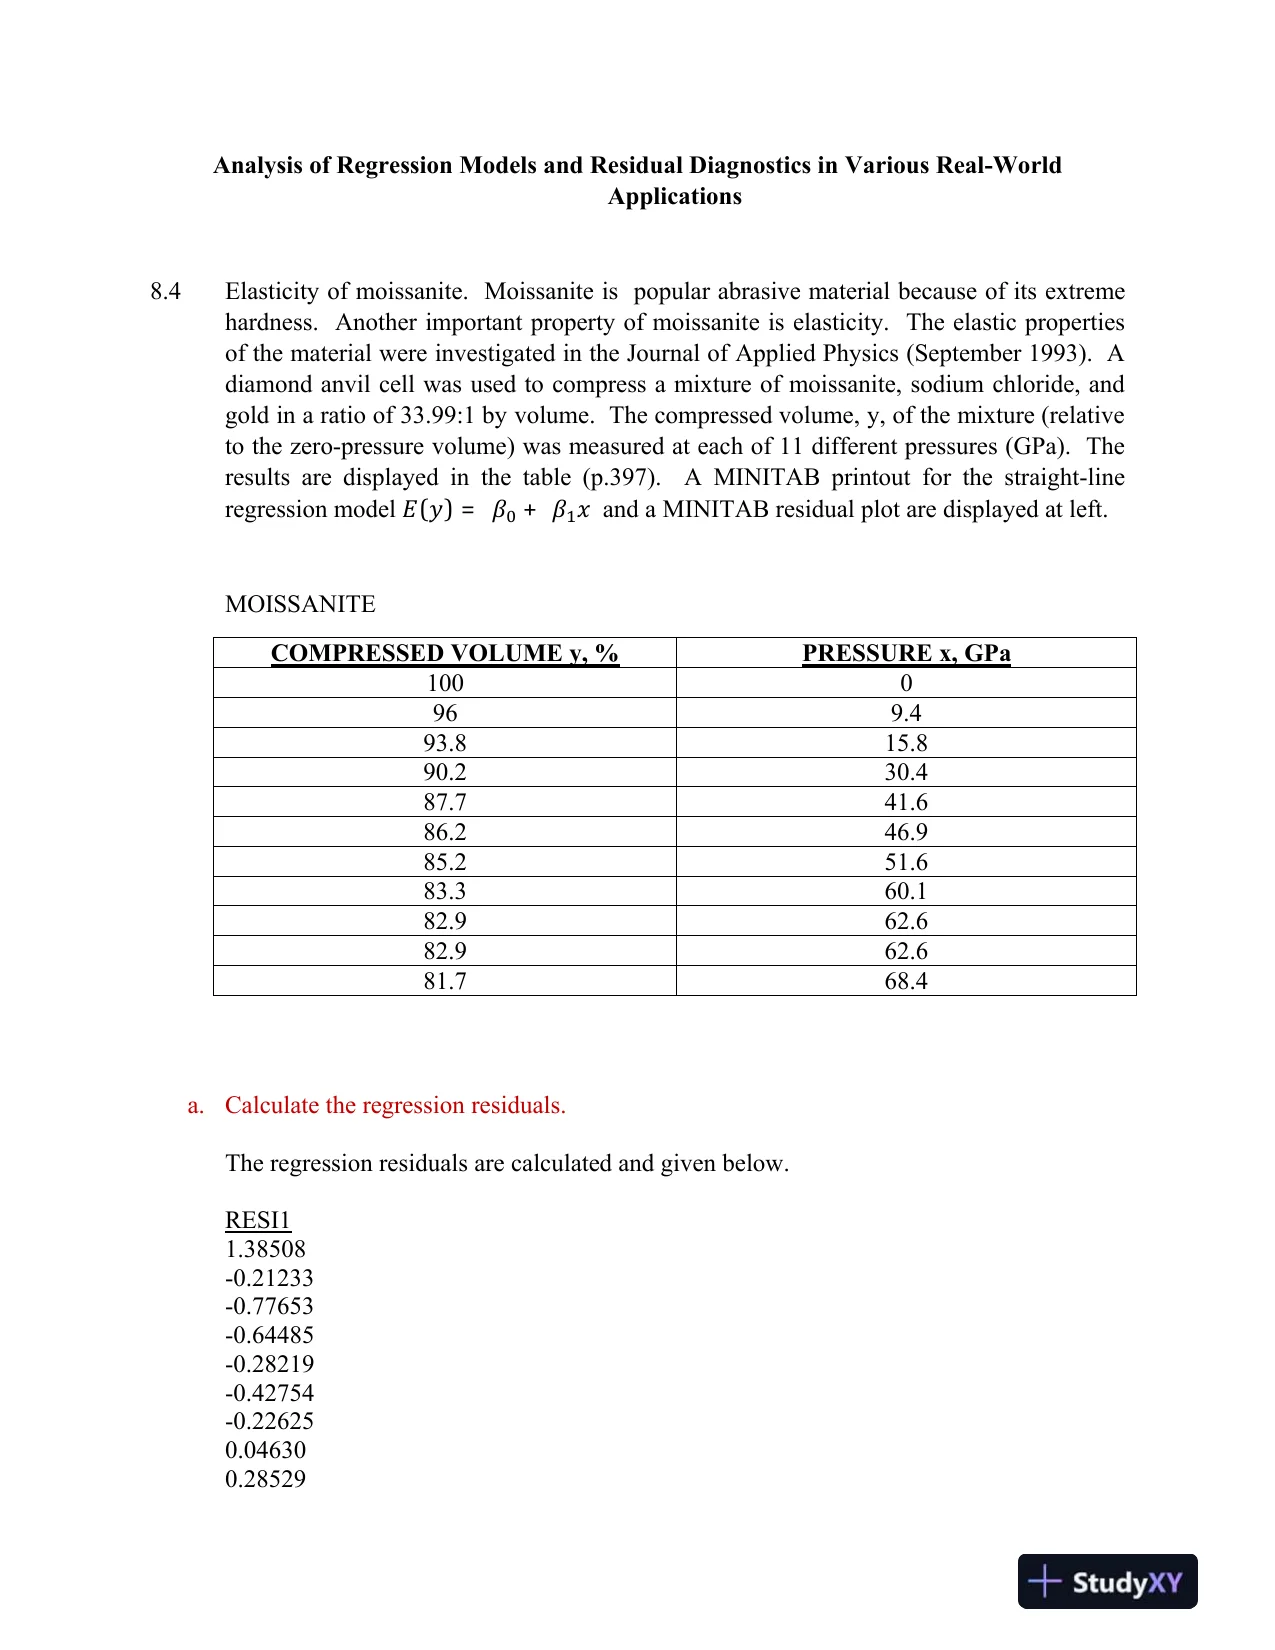
Analysis of Regression Models and Residual Diagnostics in Various Real-WorldApplications8.4Elasticity of moissanite.Moissanite ispopular abrasive material because of its extremehardness.Another important property of moissanite iselasticity.The elastic propertiesof the material were investigated in the Journal of Applied Physics (September 1993). Adiamond anvil cell was used to compress a mixture of moissanite, sodium chloride, andgold in a ratio of 33.99:1 by volume. The compressed volume, y, of the mixture (relativeto the zero-pressure volume) was measured at each of 11 different pressures (GPa). Theresults are displayed in the table (p.397).A MINITAB printout for the straight-lineregression model𝐸(𝑦)=𝛽0+𝛽1π‘₯and a MINITAB residual plot are displayed at left.MOISSANITECOMPRESSED VOLUME y, %PRESSURE x, GPa1000969.493.815.890.230.487.741.686.246.985.251.683.360.182.962.682.962.681.768.4a.Calculate the regressionresiduals.The regression residuals are calculated and given below.RESI11.38508-0.21233-0.77653-0.64485-0.28219-0.42754-0.226250.046300.28529
Page 2 of 5
Analysis of Regression Models and Residual Diagnostics in Various Real-World Applications - Page 2 preview image
Page 3 of 5
Analysis of Regression Models and Residual Diagnostics in Various Real-World Applications - Page 3 preview image0.285290.56774b.Plot the residuals against x. Do you detect a trend?The plot ofresiduals against the x values is given below.From the above graph a trend can be observed in the residuals.c.Propose an alternative model based on the plot part b.From the above plot it was observed that there is trend in the residuals.Therefore aquadratic model is considered for the above data.d.Fit and analyze the model you proposed in part c.A quadratic model is fitted for the above data and the regression coefficients are givenbelow.Regression Analysis: COMPRESSED VOLUME y, % versus PRESSURE x, GPa,x^2AnalysisofVariance
Page 4 of 5
Analysis of Regression Models and Residual Diagnostics in Various Real-World Applications - Page 4 preview imageSourceDFAdjSSAdj MSF-ValueP-ValueRegression2370.248185.1241694.300.000PRESSUREx,GPa139.32239.322359.880.000x^212.9092.90926.620.001Error80.8740.109Lack-of-Fit70.8740.125**PureError10.0000.000Total10371.122ModelSummarySR-sqR-sq(adj)R-sq(pred)0.33054999.76%99.71%99.13%CoefficientsTermCoefSE CoefT-ValueP-ValueVIFConstant99.5030.268370.880.000PRESSUREx,GPa-0.34730.0183-18.970.00017.25x^20.0013110.0002545.160.00117.25RegressionEquationCOMPRESSEDVOLUMEy,%=99.503-0.3473PRESSUREx,GPa +0.001311x^2From the above results it can be observed that the model is significant and is able toexplain 99.76% variation in compressed volume. The regression coefficients of thevariables pressure and square of pressure are significant. The residual plot against theobservations is also givenbelow;it can be observed that the plot has improved.
Page 5 of 5
Analysis of Regression Models and Residual Diagnostics in Various Real-World Applications - Page 5 preview image8.12Fair market value of Hawaiian properties.Prior to 1980, private homeowners in Hawaiihad to lease the land their homes were built on because the law (dating back to theislands’ feudal period) required that land be owned only by the big estates.After 1980,however, a new law instituted condemnation proceedings so that citizens could buy theirown land.Tocomply with the 1980 law, one large Hawaiian estate wanted to useregression analysis to estimate the fair market value of its land. Its first proposal was thequadratic model𝐸(𝑦)=𝛽0+𝛽1π‘₯+𝛽2π‘₯2HAWAIIPROPERTYLEASED FEE VALUEy, thousands of dollarsSIZEx, thousands170.713.5252.79.6387.617.6443.27.95103.811.5645.18.2
Preview Mode

This document has 16 pages. Sign in to access the full document!