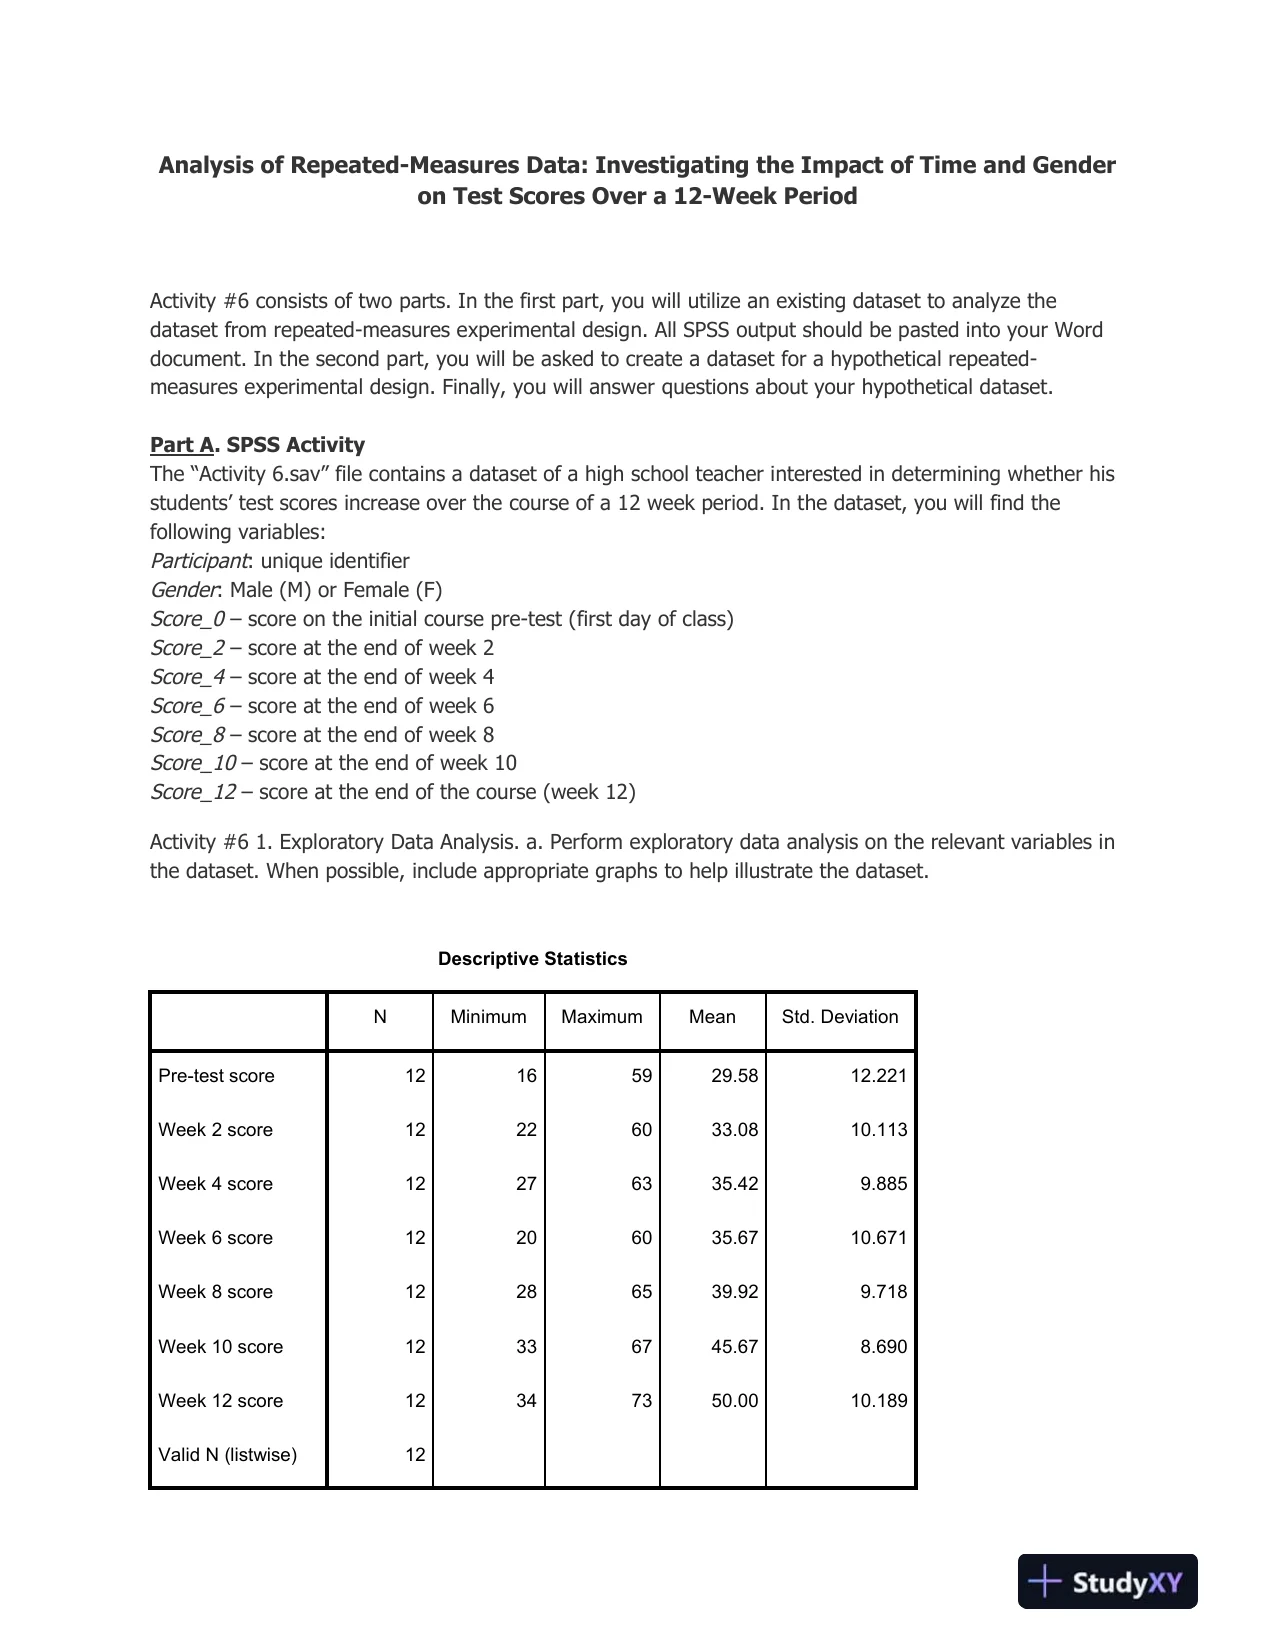
 Analysis of Repeated-Measures Data: Investigating the Impact of Time and Genderon Test Scores Over a 12-Week PeriodActivity #6 consists of two parts. In the first part, you will utilize an existing dataset to analyze thedataset fromrepeated-measures experimental design. All SPSS output should be pasted into your Worddocument. In the second part, you will be asked to create a dataset for a hypothetical repeated-measures experimental design. Finally, you will answer questions about your hypothetical dataset.Part A. SPSS ActivityThe “Activity 6.sav” file contains a dataset of a high school teacher interested in determining whether hisstudents’ test scores increase over the course of a 12 week period. In the dataset, you will find thefollowing variables:Participant: unique identifierGender: Male (M) or Female (F)Score_0–score on the initial course pre-test (first day of class)Score_2–score at the end of week 2Score_4–score at the end of week 4Score_6–score at theend of week 6Score_8–score at the end of week 8Score_10–score at the end of week 10Score_12–score at the end of the course (week 12)Activity #6 1. Exploratory Data Analysis. a. Perform exploratory data analysis on the relevant variables inthe dataset. When possible, include appropriate graphs to help illustrate the dataset.Descriptive StatisticsNMinimumMaximumMeanStd. DeviationPre-test score12165929.5812.221Week 2 score12226033.0810.113Week 4 score12276335.429.885Week 6 score12206035.6710.671Week 8 score12286539.929.718Week 10 score12336745.678.690Week 12 score12347350.0010.189Valid N (listwise)12
Preview Mode
This document has 14 pages. Sign in to access the full document!