
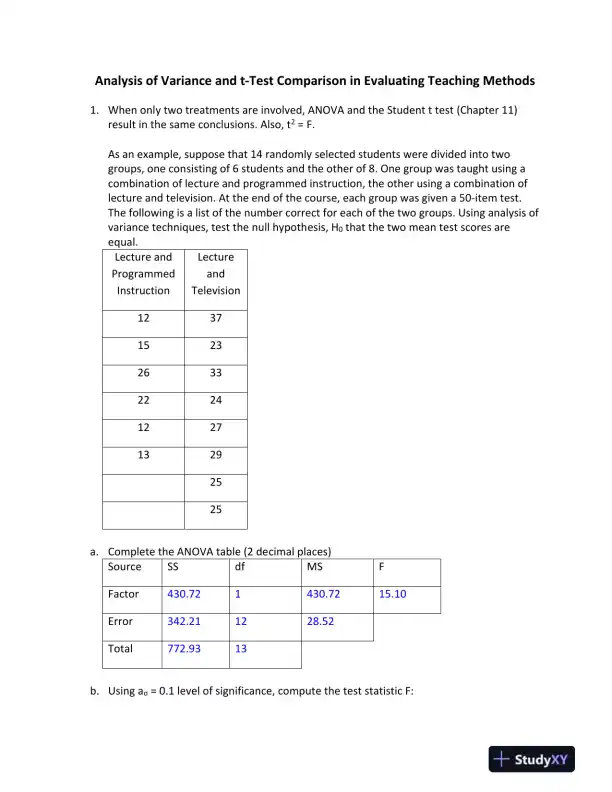
 Analysis of Variance and t-Test Comparison in Evaluating Teaching Methods1.When only two treatments are involved, ANOVA and the Student t test (Chapter 11)result in the same conclusions. Also, t2= F.As an example, suppose that 14 randomlyselected students were divided into twogroups, one consisting of 6 students and the other of 8. One group was taught using acombination of lecture and programmed instruction, the other using a combination oflecture and television. At the end of the course, each group was given a 50-item test.The following is a list of the number correct for each of the two groups. Using analysis ofvariance techniques, test the null hypothesis, H0that the two mean test scores areequal.Lecture andProgrammedInstructionLectureandTelevision1237152326332224122713292525a.Complete the ANOVA table (2 decimal places)SourceSSdfMSFFactor430.721430.7215.10Error342.211228.52Total772.9313b.Using aσ= 0.1 level of significance, compute the test statistic F:
Analysis of Variance and t-Test Comparison in Evaluating Teaching Methods
Comparison of ANOVA and t-tests in assessing teaching effectiveness.
Audrey Parker
Contributor
4.9
0
12 months ago
Preview (2 of 2 Pages)
100%
Log in to unlock
Study Now!
X-Copilot AI
Unlimited Access
Secure Payment
Instant Access
24/7 Support
Document Chat
Document Details
Subject
Statistics