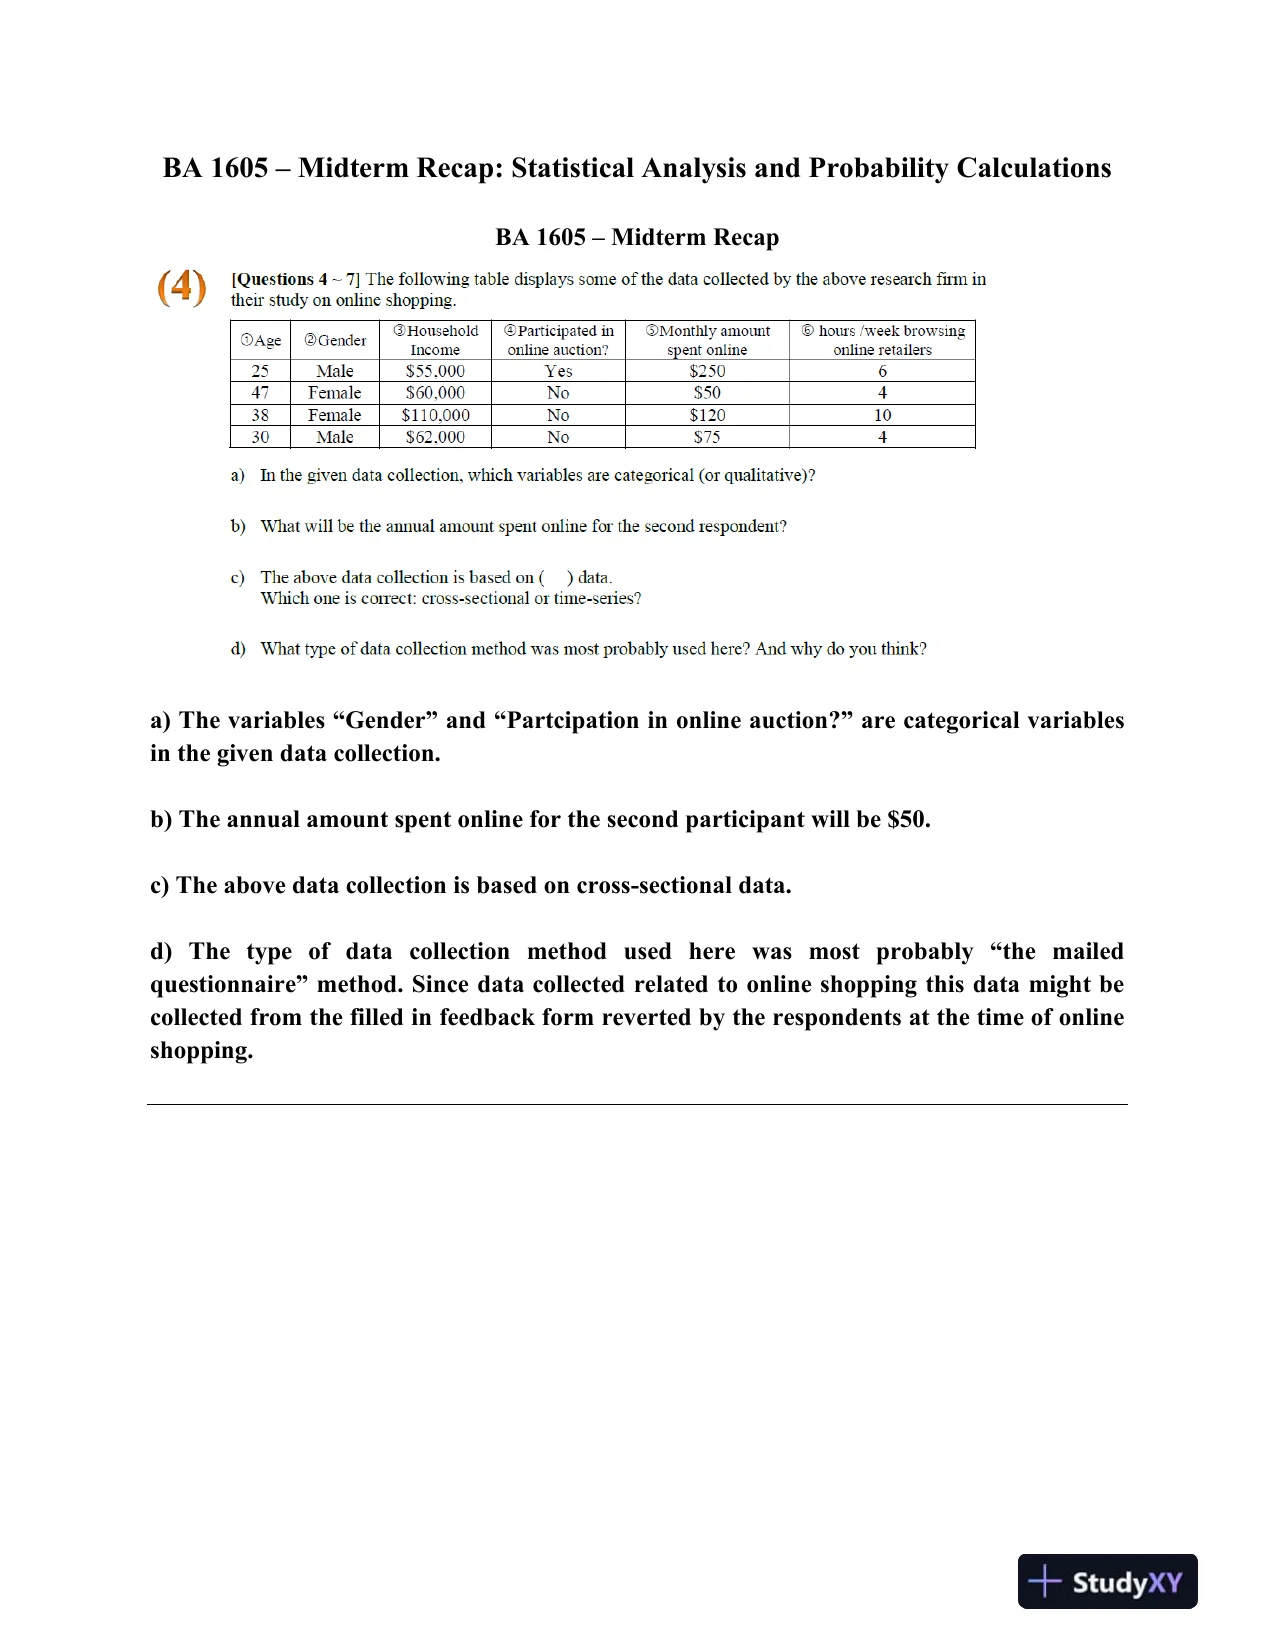
CramX Logo
BA 1605 � Midterm Recap: Statistical Analysis and Probability Calculations - Document preview page 1

BA 1605 � Midterm Recap: Statistical Analysis and Probability Calculations - Page 1

Document preview content for BA 1605 � Midterm Recap: Statistical Analysis and Probability Calculations

BA 1605 � Midterm Recap: Statistical Analysis and Probability Calculations

Midterm recap covering statistical analysis and probability calculations.

Caleb Patterson
Contributor
4.7
0
12 months ago
Preview (4 of 11 Pages)
100%
Log in to unlock
Page 1 of 4
BA 1605 � Midterm Recap: Statistical Analysis and Probability Calculations - Page 1 preview imageBA 1605Midterm Recap: Statistical Analysis and Probability CalculationsBA 1605Midterm Recapa)The variables “Gender” and “Partcipation in online auction?” are categorical variablesin the given data collection.b)The annual amount spent online for the second participant will be $50.c)The above data collection is based on cross-sectional data.d)Thetypeofdatacollectionmethodusedherewasmostprobably“themailedquestionnaire” method. Since data collected related to online shopping this data might becollected from the filled in feedback form reverted by the respondents at the time of onlineshopping.
Page 2 of 4
BA 1605 � Midterm Recap: Statistical Analysis and Probability Calculations - Page 2 preview image
Page 3 of 4
BA 1605 � Midterm Recap: Statistical Analysis and Probability Calculations - Page 3 preview imagea) Therequired Excel formula to findthe frequency of “Poor” is,“=COUNTIF (A:A, “Poor”).b)The required Excel formula in F4 is “=E4/E$7”.c)Theproper method to analyze thisdataset in Excel is“Insert Pivot Table” to constructcontingency tables since both the variables “Quality rating” and “Location” of the hotelare categorical.a)There are no quantitative variables in the table.The categorical variables in the table are Gender and Brand.
Page 4 of 4
BA 1605 � Midterm Recap: Statistical Analysis and Probability Calculations - Page 4 preview imageb)The probability that a randomly selected respondent is a female preferring Canon is,600.1111540=.c)The marginal probability of brands “Canon” is,1400.2593540=.d)The probability that the male person responses prefer Canon is,800.2963270=.e)Since the marginal probability of brands “Canon” is not same as the probability that themale person responses prefer Canon, this data does not indicate that brand prefernce isindependent of gender.a)Median = 7Q1 =5.5Q3 = 10b)Central locations:CalculationValue
Preview Mode

This document has 11 pages. Sign in to access the full document!