Comprehensive Statistical Analysis and Probability Exam

Exam answers covering statistical analysis and probability concepts.

Claire Mitchell
Contributor
4.6
59
10 months ago
Preview (5 of 16 Pages)
100%
Log in to unlock

Page 1

Comprehensive Statistical Analysis and Probability Exam - Page 1 preview image

Loading page ...

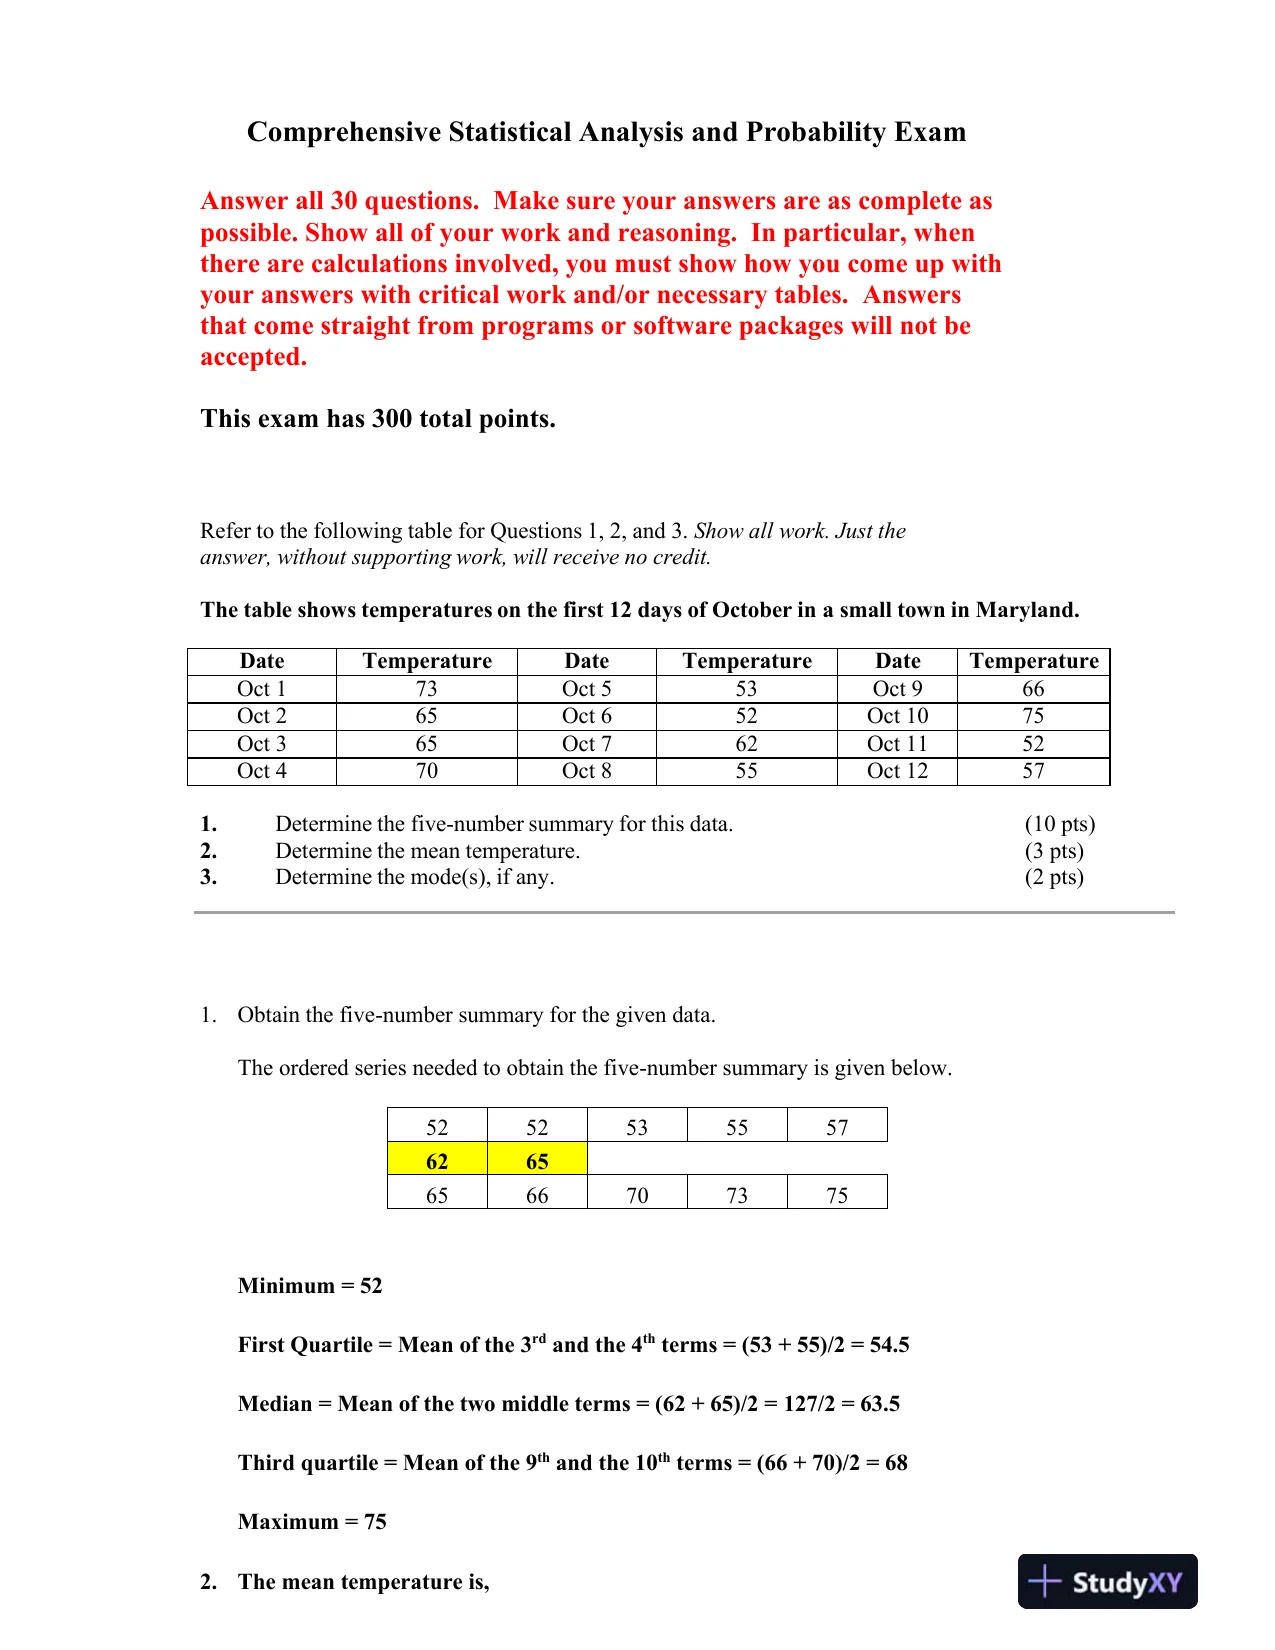
Comprehensive Statistical Analysis and Probability ExamAnswerall30questions. Makesure youranswers are ascompleteaspossible. Showall ofyourworkand reasoning. Inparticular,whenthereare calculationsinvolved,youmustshowhowyou come up withyouranswerswithcriticalworkand/or necessarytables. Answersthatcomestraightfrom programs or software packageswill not beaccepted.Thisexamhas300 total points.RefertothefollowingtableforQuestions1,2,and3.Showallwork.Justtheanswer,without supportingwork,will receivenocredit.Thetableshowstemperaturesonthefirst12daysofOctoberina smalltowninMaryland.DateTemperatureDateTemperatureDateTemperatureOct173Oct553Oct966Oct265Oct652Oct1075Oct365Oct762Oct1152Oct470Oct855Oct12571.Determinethefive-numbersummaryforthisdata.(10pts)2.Determinethemeantemperature.(3pts)3.Determinethemode(s),ifany.(2pts)1.Obtain the five-number summary for the given data.The ordered series needed to obtain the five-number summary is given below.525253555762656566707375Minimum = 52First Quartile =Mean of the 3rdand the 4thterms = (53 + 55)/2 = 54.5Median = Mean of the two middle terms = (62 + 65)/2 =127/2 = 63.5Third quartile =Mean ofthe 9thand the 10thterms = (66 + 70)/2 = 68Maximum = 752.The mean temperature is,

Page 2

Comprehensive Statistical Analysis and Probability Exam - Page 2 preview image

Loading page ...

Page 3

Comprehensive Statistical Analysis and Probability Exam - Page 3 preview image

Loading page ...

12111173655774562.08331212iixXn===+++==.3.Themode(s) is (are) the highest frequent observation(s) in the given data. Inthe given data two observations 52 and 65 are repeated twice and theremaining are appeared only once.Therefore, the required modes are 52 and 65.RefertothefollowingfrequencydistributionforQuestions4,5,6,and7.Showallwork.Justthe answer,withoutsupportingwork,will receivenocredit.Thefrequencydistributionbelowshowsthedistributionforcheckouttime(inminutes)inUMUCMiniMartbetween3:00and4:00PMonaFridayafternoon.CheckoutTime(inminutes)Frequency1.0-1.962.0-2.973.0-3.924.0-4.935.0-5.924.Whatpercentageofthecheckouttimeswaslessthan5minutes?(5pts)5.Calculate themeanofthisfrequencydistribution.(5pts)6.Calculate thestandarddeviationofthisfrequencydistribution.(10pts)7.Assumethatthesmallestobservationinthisdatasetis1.2minutes.Supposethisobservationwereincorrectlyrecordedas0.12insteadof1.2.Willthemeanincrease, decrease,orremainthesame?Willthemedianincrease,decreaseorremainthesame? Explainyouranswers.(5pts)4.ObtainThepercentage of the checkout times was less than 5 minutes,67231890%6723220+++==++++5.Obtain the mean of this frequency distribution:Checkout Time(in minutes)Frequency, fMidvalue, xf*x1.0-1.961.458.72.0-2.972.4517.15

Page 4

Comprehensive Statistical Analysis and Probability Exam - Page 4 preview image

Loading page ...

3.0-3.923.456.94.0-4.934.4513.355.0-5.925.4510.9Total2057()57The required mean2.8520fxxf===6.Obtain thestandard deviationof this frequency distribution:Checkout Time(in minutes)Frequency, fMidvalue,xf*xf*x^21.0-1.961.458.712.6152.0-2.972.4517.1542.01753.0-3.923.456.923.8054.0-4.934.4513.3559.40755.0-5.925.4510.959.405Total2057197.25( )()()222Standard deviation157197.25202011.83161.3534fxfxfsf====7.The meandecreases as the observation recorded incorrectlydecreases the sumof the observations. The median remains the same as it is a measure oflocation not influenced much by the change in extreme observations.RefertothefollowinginformationforQuestions8 and9.Showallwork.Justtheanswer,without supportingwork,will receivenocredit.A6-faceddieisrolledtwotimes.LetAbetheeventthatthe outcomeofthefirstrollisgreaterthan4.LetBbetheeventthattheoutcomeofsecondrollis anoddnumber.8.Whatistheprobabilitythatthe outcomeofthesecondrollisanoddnumber,giventhatthefirst rollisgreaterthan4?(10pts)

Page 5

Comprehensive Statistical Analysis and Probability Exam - Page 5 preview image

Loading page ...

() () () () () ()() () () () () ()() () () () () ()() () () () () ()() () () () ()In the experiment of throwing a 6-faced die two times, the sample spaceis as follows,1,1 , 1, 2 , 1,3 , 1, 4 , 1,5 , 1, 62,1 , 2, 2 , 2,3 , 2, 4 , 2,5 , 2, 63,1 , 3, 2 , 3,3 , 3, 4 , 3,5 , 3, 64,1 , 4, 2 , 4,3 , 4, 4 , 4,5 , 4, 65,1 , 5, 2 , 5,3 , 5, 4 , 5,5 ,S=()() () () () () ()()()365, 66,1 , 6, 2 , 6,3 , 6, 4 , 6,5 , 6, 6Letbe the event that the outcome of the first roll is greater than 4. Letbe theevent that the outcome of second roll is an odd number.5,1n SABA==() () () () ()() () () () () ()()() () () () () ()() () () () () ()() () () () () ()()() () () () () ()(), 5, 2 , 5,3 , 5, 4 , 5,5 , 5, 6126,1 , 6, 2 , 6,3 , 6, 4 , 6,5 , 6, 61,1 , 1,3 , 1,5 , 2,1 , 2,3 , 2,5 ,3,1 , 3,3 , 3,5 , 4,1 , 4,3 , 4,5 ,185,1 , 5,3 , 5,5 , 6,1 , 6,3 , 6,55,1 , 5,3 , 5,5 , 6,1 , 6,3 , 6,56The probability thn ABn BABn AB=====()()()at the outcome of the second roll is an odd number, given thatthe first roll is greater than 4 is,61|122n ABP BAn A===9.AreAandBindependent?Whyorwhynot?(5pts)( )()()()()()()1From the Question 8 , we have|2Obtian the probability of the event that the outcome of second roll is an181odd number, i.e..3621Since|, the eventsandare independent.2P BAn BP Bn SP BAP BAB======Refertothefollowingdatatoanswerquestions10and11.Showall work.Justtheanswer, withoutsupportingwork,will receivenocredit.ArandomsampleofSTAT200weeklystudytimesinhoursisasfollows:21415182010.Findthestandarddeviation.(10pts)
Preview Mode

This document has 16 pages. Sign in to access the full document!