Comprehensive Statistical Analysis And Probability Problems

This Assignment Solution covers comprehensive statistical analysis and probability problems.

David Brown
Contributor
4.7
51
10 months ago
Preview (11 of 35 Pages)
100%
Log in to unlock

Page 1

Comprehensive Statistical Analysis And Probability Problems - Page 1 preview image

Loading page ...

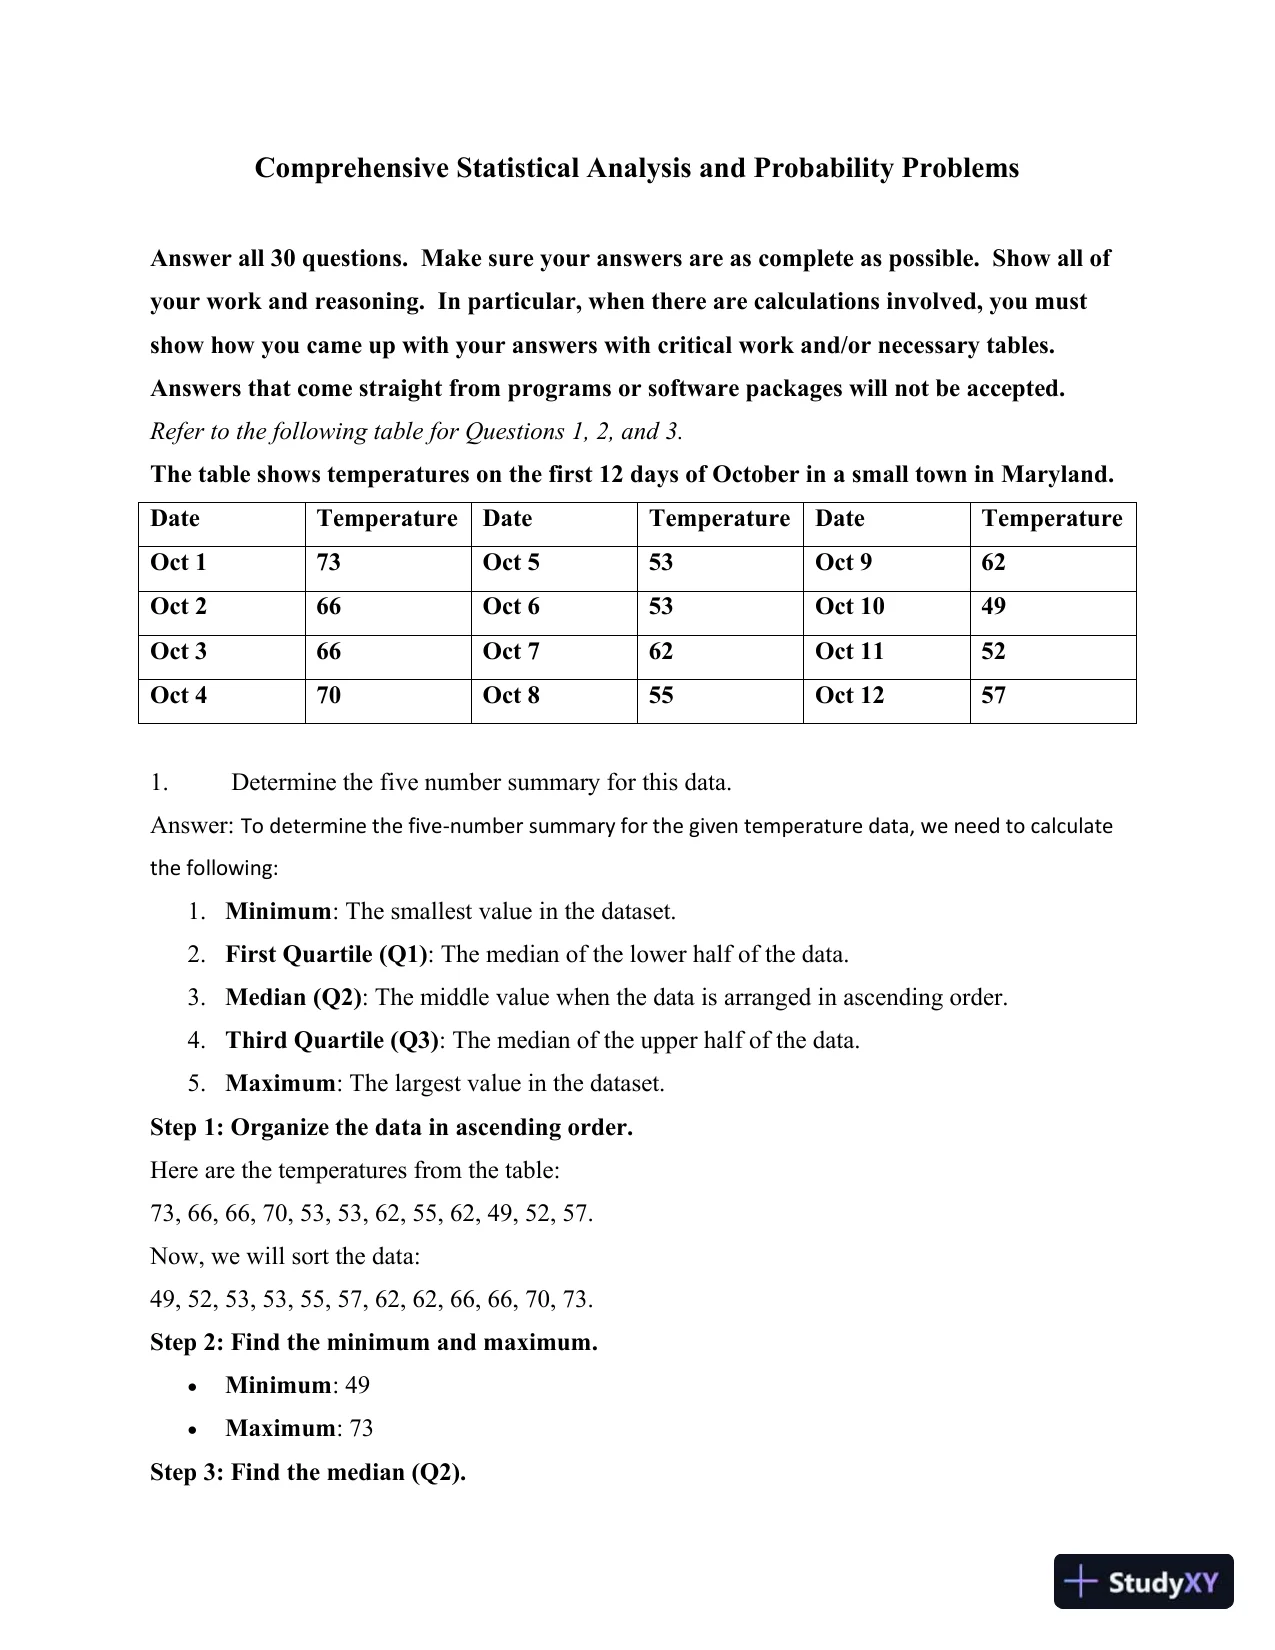
Comprehensive Statistical Analysis and Probability ProblemsAnswer all 30 questions. Make sure your answers are as complete as possible. Show all ofyour work and reasoning. In particular, when there are calculations involved, you mustshow how youcame up with your answers with critical work and/or necessary tables.Answers that come straight from programs or software packages will not be accepted.Refer to the following table for Questions 1, 2, and3.The table shows temperatures on the first 12 days of October in a small town in Maryland.DateTemperatureDateTemperatureDateTemperatureOct 173Oct 553Oct 962Oct 266Oct 653Oct 1049Oct 366Oct 762Oct 1152Oct 470Oct 855Oct 12571.Determine the five number summary for this data.Answer:To determine the five-number summary for the given temperature data, we need to calculatethe following:1.Minimum: The smallest value in the dataset.2.First Quartile (Q1): The median of the lowerhalf of the data.3.Median (Q2): The middle value when the data is arranged in ascending order.4.Third Quartile (Q3): The median of the upper half of the data.5.Maximum: The largest value in the dataset.Step 1: Organize the data in ascending order.Here are the temperatures from the table:73, 66, 66, 70, 53, 53, 62, 55, 62, 49, 52, 57.Now, we will sort the data:49, 52, 53, 53, 55, 57, 62, 62, 66, 66, 70, 73.Step 2: Find the minimum and maximum.Minimum: 49Maximum: 73Step 3: Find the median (Q2).

Page 2

Comprehensive Statistical Analysis And Probability Problems - Page 2 preview image

Loading page ...

Page 3

Comprehensive Statistical Analysis And Probability Problems - Page 3 preview image

Loading page ...

The median is the middle value of the ordered data. Since there are 12 data points, the medianwill be the average of the 6th and 7th values.The 6th value is57and the 7th value is62.Median(Q2)=57+622=1192=59.5\text{Median (Q2)} =\frac{57 + 62}{2} =\frac{119}{2} =59.5Step 4: Find the first quartile (Q1).The first quartile is the median of the lower half of the data (the first 6 values):49, 52, 53, 53, 55, 57.The median of these values is the average of the 3rd and 4th values:The 3rd value is53and the 4th value is53.Q1=53+532=53\text{Q1} =\frac{53 + 53}{2} = 53Step 5: Find the third quartile (Q3).The third quartile is the median of the upper half of the data (the last 6 values):62, 62, 66, 66, 70, 73.The median of these values is the average of the 3rd and 4th values:The 3rd value is66and the 4th value is66.Q3=66+662=66\text{Q3} =\frac{66 + 66}{2} = 66Step 6: Write the five-number summary.Now that we have all the values, the five-number summary is:Minimum: 49Q1: 53Median (Q2): 59.5Q3: 66Maximum: 73So, the five-number summary is:49, 53, 59.5, 66, 73.2.Determine the mean temperature.Answer:To determine the mean temperature, we need to find the sum of all the temperatures andthendivide by the number of days (which is 12 in this case).Step 1: Sum of all the temperatures

Page 4

Comprehensive Statistical Analysis And Probability Problems - Page 4 preview image

Loading page ...

The temperatures are:73, 66, 66, 70, 53, 53, 62, 55, 62, 49, 52, 57.Now, let's add them up:73+66+66+70+53+53+62+55+62+49+52+57=71373 + 66 + 66 + 70 + 53 + 53 + 62 + 55 + 62 +49 + 52 + 57 = 713Step 2: Calculate the meanTo find the mean, divide the sum by the number of days (12):Mean=71312≈59.42\text{Mean} =\frac{713}{12}\approx 59.42Final Answer:The mean temperature is approximately59.42°F.3.Determine the mode(s), if any.Answer:Themodeis the value that appears most frequently in a dataset.Let's look at the temperatures again:73, 66, 66, 70, 53, 53, 62, 55, 62, 49, 52, 57.Now, let's count how many times each temperature appears:73appears1time.66appears2times.70appears1time.53appears2times.62appears2times.55appears1time.49appears1time.52appears1time.57appears1time.Step 2:Determine the mode(s)The temperatures that appear the most frequently (2 times each) are:665362Final Answer:

Page 5

Comprehensive Statistical Analysis And Probability Problems - Page 5 preview image

Loading page ...

There arethree modesin this dataset:66,53, and62. This is called amultimodaldistribution.Refer to the following situation forQuestions 4, 5, and 6.Consider the following distribution by age groups.AgeFrequencyRelative Frequency10140.0415-192024102529630345353944044245491Total504.Complete the table.Answer:To complete the table, we need to fill in the missing frequencies and relative frequencies.We are given:The total frequency is 50.The relative frequency for the age group 10-14 is 0.04.The frequencies for the agegroups 20-24, 25-29, 30-34, 35-39, 40-44, and 45-49 areprovided as 10, 6, 5, 4, 2, and 1, respectively.Step 1: Find the missing frequency for the age group 15-19.The sum of the frequencies should equal the total frequency, which is 50. So, we calculate themissing frequency for the 15-19 age group.We already know the following frequencies:20-24: 1025-29: 630-34: 535-39: 4

Page 6

Comprehensive Statistical Analysis And Probability Problems - Page 6 preview image

Loading page ...

40-44: 245-49: 1Let's add these up:10+6+5+4+2+1=2810 + 6 + 5 + 4 + 2 + 1 = 28Now, subtract this from the totalfrequency (50) to find the frequency for the 15-19 age group:50−28=2250-28 = 22So, the frequency for the 15-19 age group is 22.Step 2: Find the relative frequency for each group.Relative frequency is calculated as:Relativefrequency=FrequencyofthegroupTotalfrequency\text{Relative frequency} =\frac{\text{Frequency of the group}}{\text{Total frequency}}Complete table:Now the table is complete! Let me know if you'd like more clarification or further help.5.Is the distributionbell-shaped, skewed to the left, or skewed to the right? Explain youranswer.Answer:To determine whether the distribution is bell-shaped, skewed to the left, or skewed to theright, we need to analyze the relative frequencies across the age groups.Here’s a quick rundown of the distribution:

Page 7

Comprehensive Statistical Analysis And Probability Problems - Page 7 preview image

Loading page ...

The frequencies are highest in the 15-19 age group (22), followed by the 20-24 age group(10), and then decrease as the age increases. The frequencies steadily decrease as wemove from the younger age groups to the older age groups.Key Observations:Skewed to the Right: This occurs when the right tail (older ages) is longer or morespread out than the left tail (younger ages), meaning the majority of the data isconcentrated in the lower ages, and there are a fewhigher values.Bell-shaped: A bell-shaped distribution would show a peak in the middle withfrequencies decreasing symmetrically on both sides.Skewed to the Left: This occurs when the left tail (younger ages) is longer or morespread out than the right tail (older ages), meaning the data is concentrated in the higherages.In this case:The distribution has a peak at the 15-19 age group and then the frequencies decrease asthe age groups increase.There is a clear drop-off after the 15-19 group, especially with very low frequencies inthe 40-44 (2) and 45-49 (1) groups.Conclusion:This distribution isskewed to the right. The higher frequencies are concentrated in the youngerage groups (particularly 15-19), and the frequencies decrease as the age increases, especiallyafter the 20-24 group. This indicates a longer tail on the right side, which is characteristic of aright-skewed distribution.6.In what age range is the median? Explain your answer.Answer:To determine themedianage range, we need to find the age group that contains the middlevalue of the distribution. The median is the point that divides the distribution into two equal parts, sowe must locate the cumulative frequency that corresponds to the 50th percentile (half of the total data,since we have a total of 50 data points).Step 1: Find the cumulative frequencies.We'll calculate the cumulative frequencies for each age group.

Page 8

Comprehensive Statistical Analysis And Probability Problems - Page 8 preview image

Loading page ...

Step 2: Identify the median position.Since we have a total of50data points, the median will be the25thdata point (because 50 ÷ 2 =25).Step 3: Determine which age group contains the 25th data point.The cumulative frequency up to the 15-19 age group is24, so the 25th data point must bein the next age group.The cumulative frequency up to the 20-24 age group is34. Since the 25th data point liesbetween 25 and 34, it falls within the20-24 age group.Conclusion:Themedianfalls within the20-24age range, because the 25th data point falls within thecumulative frequency of 24 to 34.7.Your entire gold coin collection consists of 5 coins. Their weights are 2, 3, 8, 7, and 6ounces respectively. Find the standard deviation of their weights. Show all work.Answer:To find the standard deviation of the gold coin collection, we need to follow these steps:Step 1: Find the mean (average) weight of the coins.The weights of the coins are:2, 3, 8, 7, and 6 ounces.The formula for the mean is:

Page 9

Comprehensive Statistical Analysis And Probability Problems - Page 9 preview image

Loading page ...

Mean=SumofallweightsNumberofcoins\text{Mean} =\frac{\text{Sum of allweights}}{\text{Number of coins}}First, sum the weights of the coins:2+3+8+7+6=262 + 3 + 8 + 7 + 6 = 26Now, divide by the number of coins (5):Mean=265=5.2\text{Mean} =\frac{26}{5} = 5.2Step 2: Find the squared deviations from the mean.Next, for each coin, we subtract the mean (5.2) from its weight and then square the result.For the 2-ounce coin:(2−5.2)2=(−3.2)2=10.24(2-5.2)^2 = (-3.2)^2 = 10.24For the 3-ounce coin:(3−5.2)2=(−2.2)2=4.84(3-5.2)^2 = (-2.2)^2 = 4.84For the 8-ounce coin:(8−5.2)2=(2.8)2=7.84(8-5.2)^2 = (2.8)^2 = 7.84For the 7-ounce coin:(7−5.2)2=(1.8)2=3.24(7-5.2)^2 = (1.8)^2 = 3.24For the 6-ounce coin:(6−5.2)2=(0.8)2=0.64(6-5.2)^2 = (0.8)^2 = 0.64Step 3: Find the variance.Now, we calculate the variance. The variance is the average ofthe squared deviations. First, sumall the squared deviations:10.24+4.84+7.84+3.24+0.64=26.810.24 + 4.84 + 7.84 + 3.24 + 0.64 = 26.8Now, divide by the number of coins (5) to get the variance:Variance=26.85=5.36\text{Variance} =\frac{26.8}{5} = 5.36Step 4: Find the standard deviation.The standard deviation is the square root of the variance:StandardDeviation=5.36≈2.32\text{Standard Deviation} =\sqrt{5.36}\approx 2.32Final Answer:The standard deviation of the weights of the gold coins is approximately2.32 ounces.Refer to the following information for Questions 8 and 9.

Page 10

Comprehensive Statistical Analysis And Probability Problems - Page 10 preview image

Loading page ...

In a recent survey, participants were asked which Apple products influenced them themost.iPodiPhoneiPadTotalAge under 2070100130300Age 204016014090390Age over 4019011050350Total42035027010408.What is the probability that the participant was aged 2040 or was influenced by iPadthe most?Answer:To calculate the probability that a participant was aged 20-40orwas influenced by the iPad themost, we need to use theaddition rule of probability. The formula for this rule is:P(AB)=P(A)+P(B)−P(A∩B)P(A\cup B) = P(A) + P(B)-P(A\cap B)Where:P(A)P(A) is the probability of the participant being aged 20-40,P(B)P(B) is the probability of the participant being influenced by the iPad,P(A∩B)P(A\cap B) is the probability of the participant being both aged 20-40 andinfluenced by the iPad.Step 1: Find the probability of being aged 20-40 (P(A)P(A)).The total number of participants is 1040. The number of participants aged 20-40 is 390.P(A)=Numberofparticipantsaged20-40Totalparticipants=3901040P(A) =\frac{\text{Numberof participants aged 20-40}}{\text{Total participants}} =\frac{390}{1040} P(A)=0.375P(A) =0.375Step 2: Find the probability of being influenced by the iPad the most (P(B)P(B)).The number of participants influenced by the iPad the most is the total number of participantswho selected iPad, which is 270.P(B)=NumberofparticipantsinfluencedbyiPadTotalparticipants=2701040P(B) =\frac{\text{Number of participants influenced by iPad}}{\text{Total participants}} =\frac{270}{1040} P(B)=0.2596P(B) = 0.2596

Page 11

Comprehensive Statistical Analysis And Probability Problems - Page 11 preview image

Loading page ...

Step 3: Find the probability of being both aged 20-40 and influenced by the iPad the most(P(A∩B)P(A\cap B)).From the table, the number of participants aged 20-40 who were influenced by iPad the most is90.P(A∩B)=Numberofparticipantsaged20-40andinfluencedbyiPadTotalparticipants=901040P(A\cap B) =\frac{\text{Number ofparticipants aged 20-40 and influenced by iPad}}{\text{Total participants}} =\frac{90}{1040}P(A∩B)=0.0865P(A\cap B) = 0.0865Step 4: Apply the addition rule.Now, use the addition rule to calculate the total probability:P(AB)=P(A)+P(B)−P(A∩B)P(A\cup B) = P(A) + P(B)-P(A\cap B)P(AB)=0.375+0.2596−0.0865P(A\cup B) = 0.375 + 0.2596-0.0865 P(AB)=0.5481P(A\cupB) = 0.5481Final Answer:The probability that the participant was aged 20-40orwas influenced by the iPad the most isapproximately0.5481or54.81%.9.What is the probability that the participant was influenced by iPod the most, given thatthe participant is “Age Under 20?”Answer:To calculate the probability that the participant was influenced by the iPod the most, giventhat the participant isaged under 20, we can use theconditional probability formula:P(iPodAgeunder20)=P(iPodandAgeunder20)P(Ageunder20)P(\text{iPod}\mid\text{Ageunder 20}) =\frac{P(\text{iPod and Age under 20})}{P(\text{Age under 20})}Step 1: Find P(Ageunder20)P(\text{Age under 20}).The total number of participants is 1040. The number of participants aged under 20 is 300.P(Ageunder20)=3001040=0.2885P(\text{Age under 20}) =\frac{300}{1040} = 0.2885Step 2: Find P(iPodandAgeunder20)P(\text{iPod and Age under 20}).The number of participants aged under 20 who were influenced by the iPod the most is 70.P(iPodandAgeunder20)=701040=0.0673P(\text{iPod and Age under 20}) =\frac{70}{1040}= 0.0673Step 3: Calculate the conditional probability.
Preview Mode

This document has 35 pages. Sign in to access the full document!