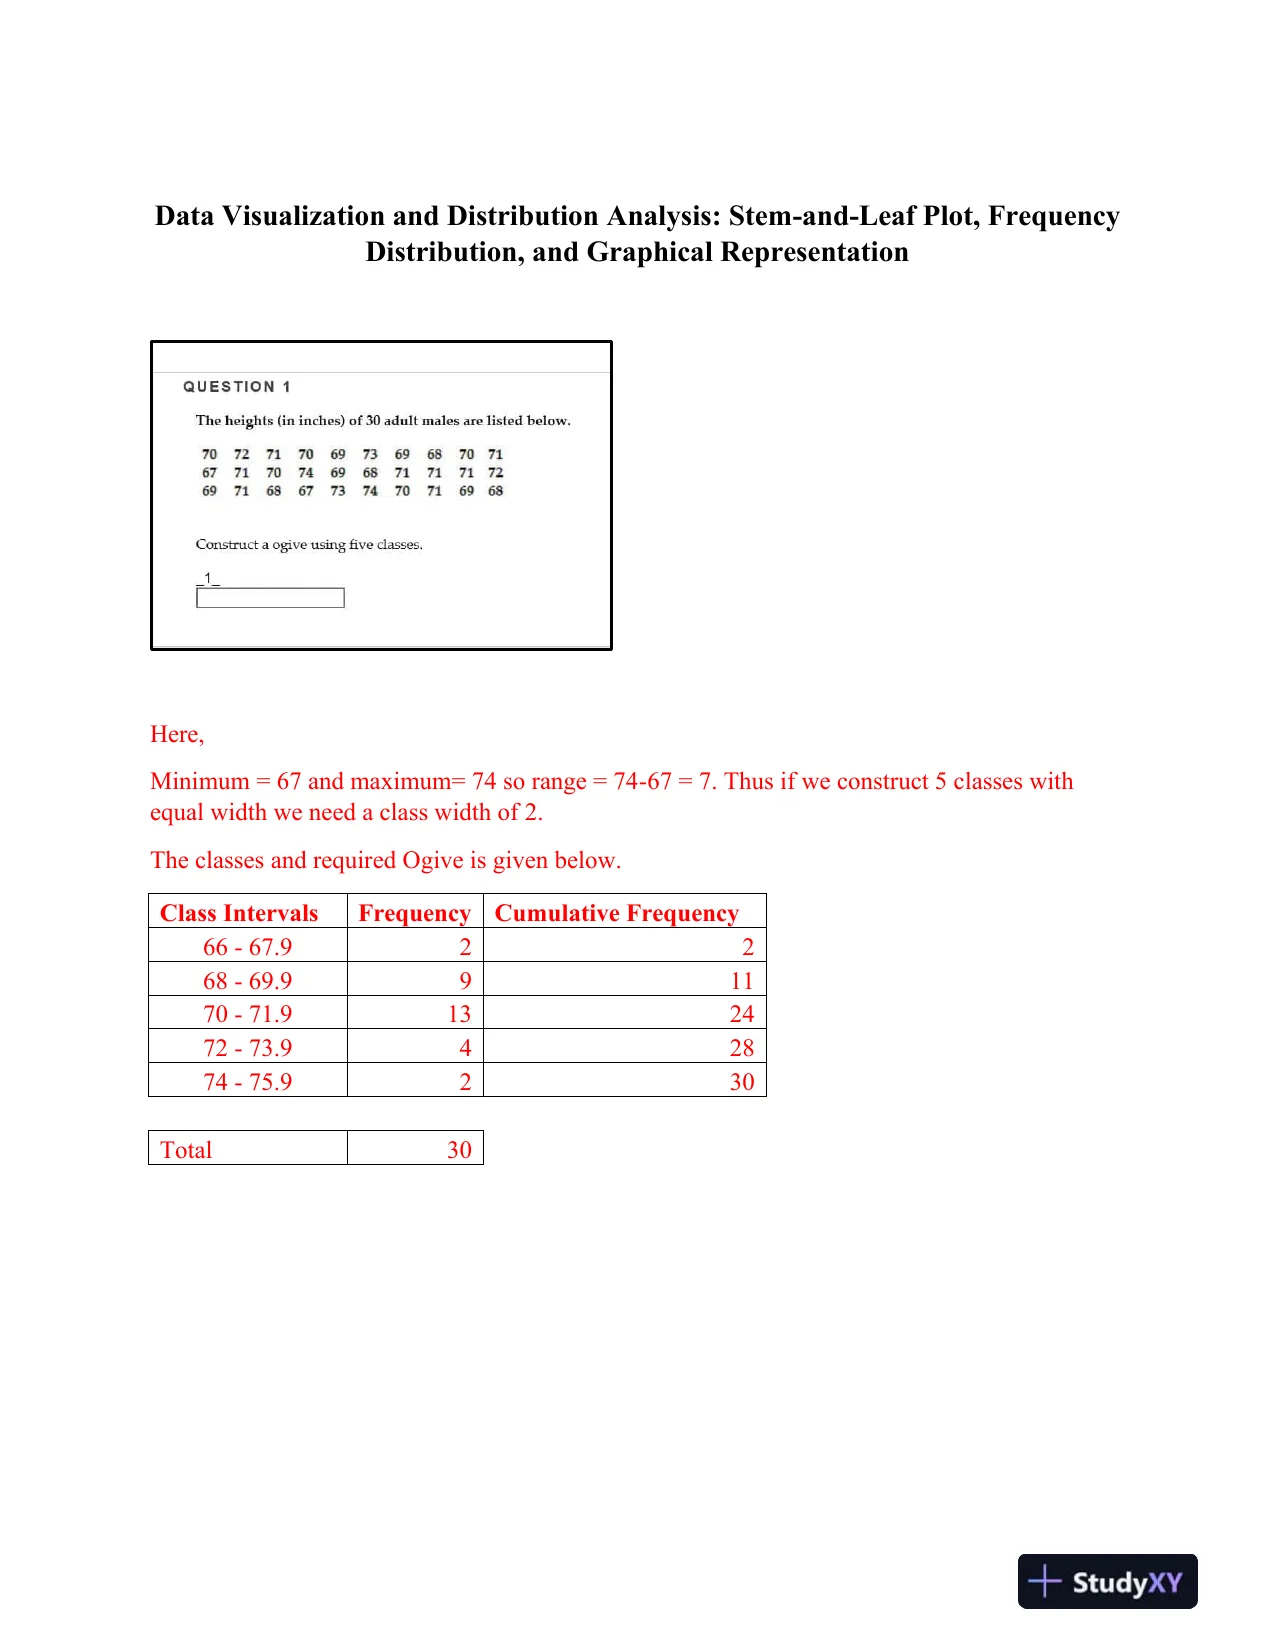
Data Visualization and Distribution Analysis: Stem-and-Leaf Plot, FrequencyDistribution, and Graphical RepresentationHere,Minimum = 67 and maximum= 74 so range = 74-67 = 7. Thus if we construct 5 classes withequal width we need a class width of 2.The classes andrequired Ogive is given below.ClassIntervalsFrequencyCumulative Frequency66-67.92268-69.991170-71.9132472-73.942874-75.9230Total30
Page 2 of 3
Page 3 of 3
Option DThe constructed Stem-and-leaf plot is given below,
Preview Mode
This document has 7 pages. Sign in to access the full document!