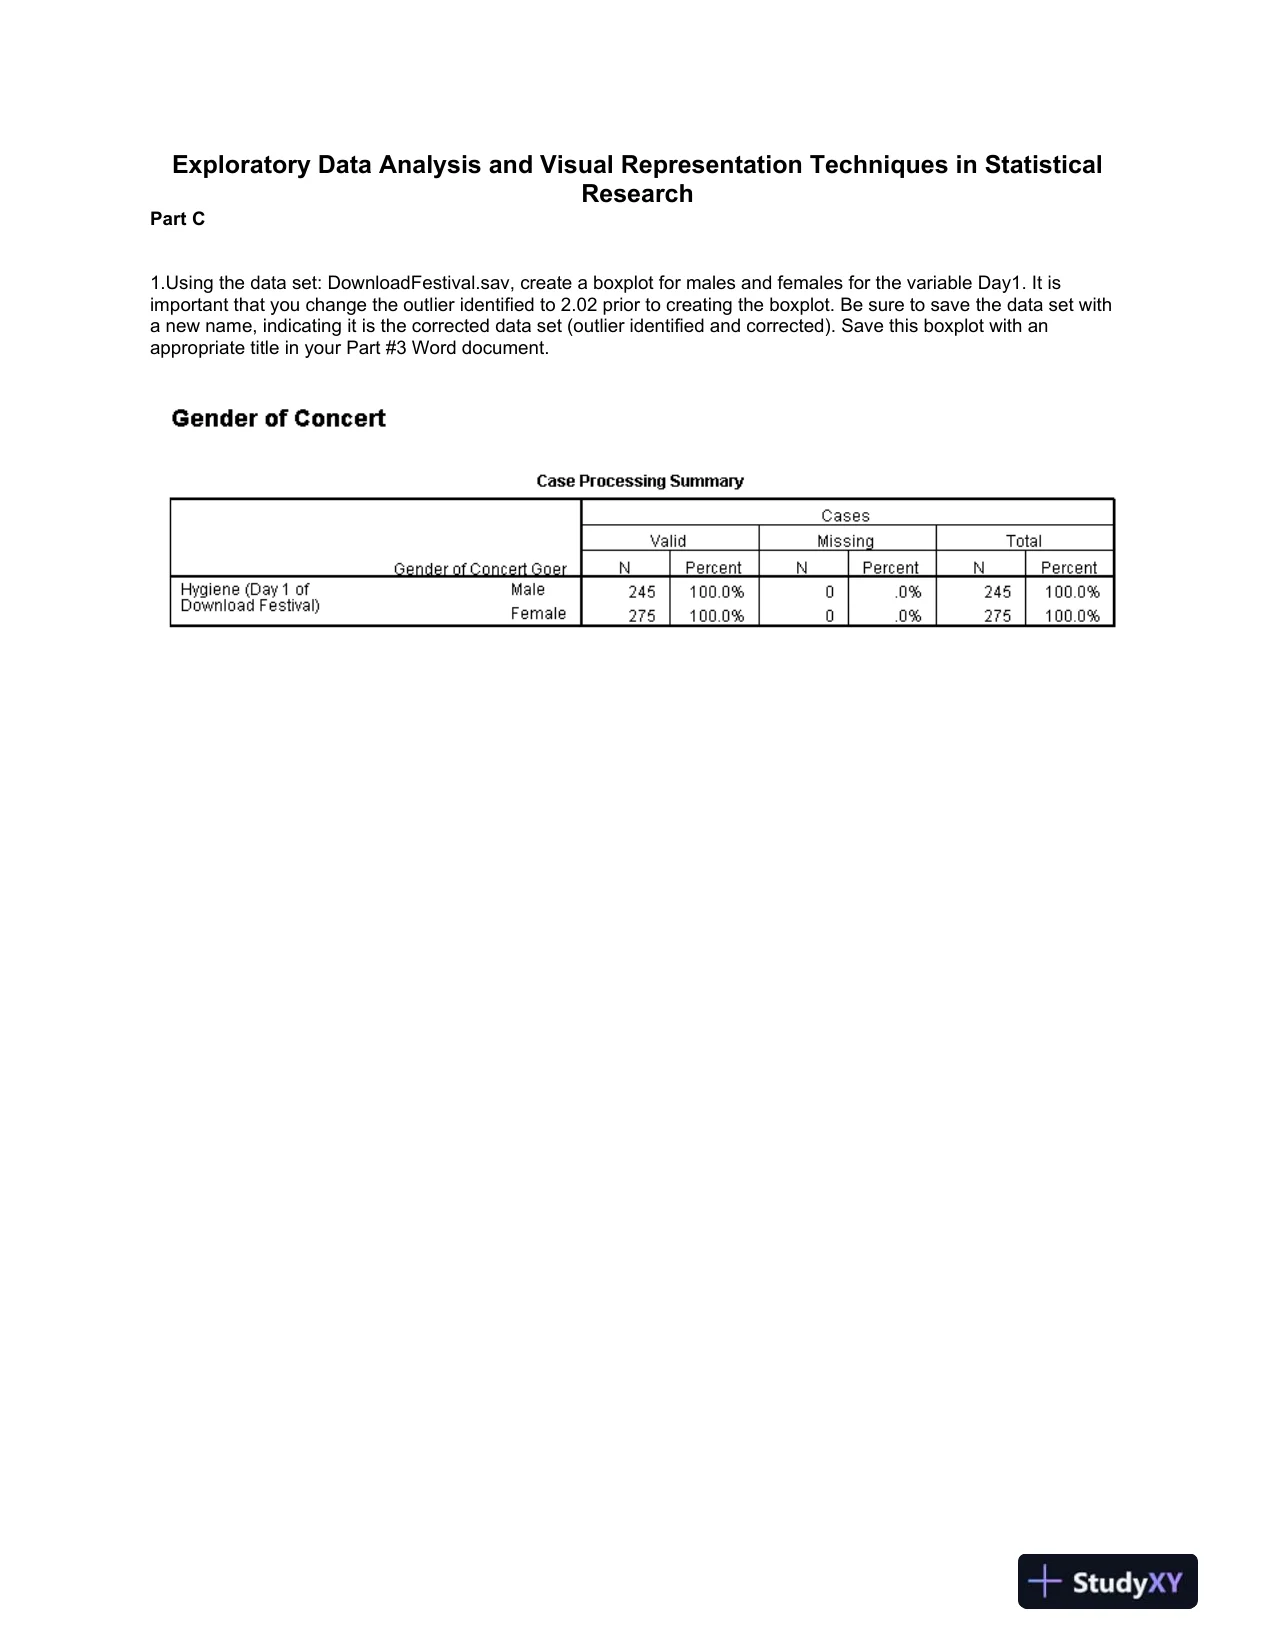
 Exploratory Data Analysis and Visual Representation Techniques in StatisticalResearchPart C1.Using the data set: DownloadFestival.sav, create a boxplot for males and females for the variable Day1. It isimportant that you change the outlier identified to 2.02 prior to creating the boxplot. Be sure to save the data set witha new name, indicating it is the corrected data set (outlier identified and corrected). Save this boxplot with anappropriate title in your Part #3 Word document.
Preview Mode
This document has 7 pages. Sign in to access the full document!