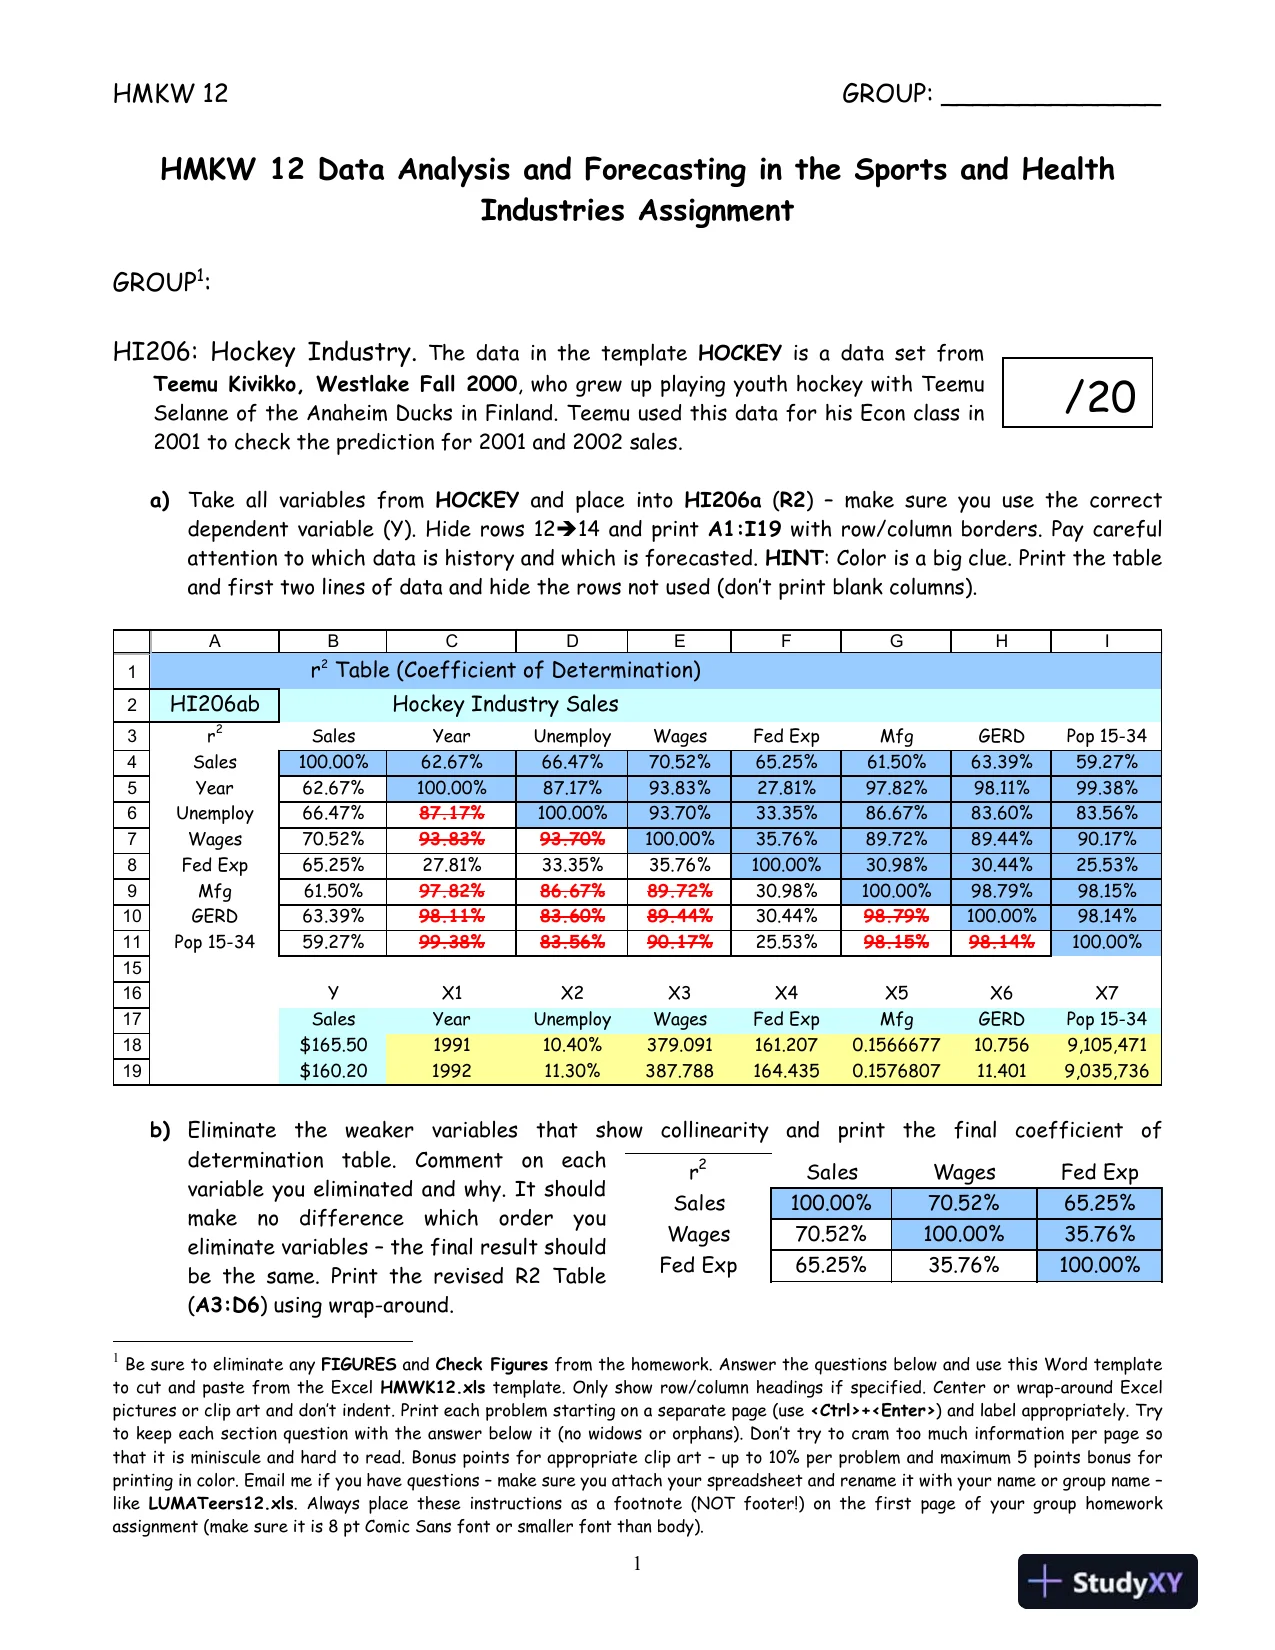
 HMKW12GROUP: ______________1HMKW 12Data Analysis and Forecasting in the Sports and HealthIndustries AssignmentGROUP1:HI206: Hockey Industry.The data in the templateHOCKEYis a data set fromTeemu Kivikko, WestlakeFall2000, who grew up playing youth hockey with TeemuSelanne of the Anaheim Ducks in Finland. Teemu used this data for his Econ class in2001 to check theprediction for2001 and 2002 sales.a)Take all variablesfromHOCKEYand place intoHI206a(R2)–makesure you use the correctdependent variable (Y).Hide rows 1214 and printA1:I19with row/column borders.Pay carefulattention to which data is history and which is forecasted.HINT: Color is a big clue. Print the tableand first two lines of data and hide the rows not used (don’t print blank columns).b)Eliminatetheweakervariablesthatshowcollinearityandprintthefinalcoefficientofdeterminationtable.Commentoneachvariable you eliminated and why.It shouldmakenodifferencewhichorderyoueliminate variables–the final result shouldbe the same. Print the revised R2 Table(A3:D6)using wrap-around.1Be sure to eliminate anyFIGURESandCheck Figuresfrom the homework. Answer the questions below and use this Word templateto cut and paste from the ExcelHMWK12.xlstemplate. Only show row/column headings if specified. Center or wrap-around Excelpictures or clip art and don’t indent.Print each problem starting on a separate page (use<Ctrl>+<Enter>)and label appropriately. Tryto keep each section question with the answer below it (no widows or orphans). Don’t try to cram too much information per page sothat it is miniscule and hard to read. Bonus points for appropriate clip art–up to 10% per problem and maximum 5 points bonus forprinting in color. Email me if you have questions–make sure you attach your spreadsheet and rename it with your name or group name–likeLUMATeers12.xls. Always place these instructions as a footnote (NOT footer!) on the first page of your group homeworkassignment (make sure it is 8 pt Comic Sans font or smaller font than body).12345678910111516171819ABCDEFGHIHI206abr2SalesYearUnemployWagesFed ExpMfgGERDPop 15-34Sales100.00%62.67%66.47%70.52%65.25%61.50%63.39%59.27%Year62.67%100.00%87.17%93.83%27.81%97.82%98.11%99.38%Unemploy66.47%87.17%100.00%93.70%33.35%86.67%83.60%83.56%Wages70.52%93.83%93.70%100.00%35.76%89.72%89.44%90.17%Fed Exp65.25%27.81%33.35%35.76%100.00%30.98%30.44%25.53%Mfg61.50%97.82%86.67%89.72%30.98%100.00%98.79%98.15%GERD63.39%98.11%83.60%89.44%30.44%98.79%100.00%98.14%Pop 15-3459.27%99.38%83.56%90.17%25.53%98.15%98.14%100.00%YX1X2X3X4X5X6X7SalesYearUnemployWagesFed ExpMfgGERDPop 15-34$165.50199110.40%379.091161.2070.156667710.7569,105,471$160.20199211.30%387.788164.4350.157680711.4019,035,736r2Table (Coefficient of Determination)Hockey Industry Sales/20r2SalesWagesFed ExpSales100.00%70.52%65.25%Wages70.52%100.00%35.76%Fed Exp65.25%35.76%100.00%
Preview Mode
This document has 14 pages. Sign in to access the full document!