CramX Logo
Homework assignment Week 2: Statistical Data Analysis: Descriptive Statistics, Graphical Representations, and Case Study Evaluations - Document preview page 1

Homework assignment Week 2: Statistical Data Analysis: Descriptive Statistics, Graphical Representations, and Case Study Evaluations - Page 1

Document preview content for Homework assignment Week 2: Statistical Data Analysis: Descriptive Statistics, Graphical Representations, and Case Study Evaluations

Homework assignment Week 2: Statistical Data Analysis: Descriptive Statistics, Graphical Representations, and Case Study Evaluations

Week 2 homework solving problems in descriptive statistics, visualization, and case study evaluations.

Andrew Taylor
Contributor
4.1
0
12 months ago
Preview (4 of 12 Pages)
100%
Log in to unlock
Page 1 of 4
Homework assignment Week 2: Statistical Data Analysis: Descriptive Statistics, Graphical Representations, and Case Study Evaluations - Page 1 preview image
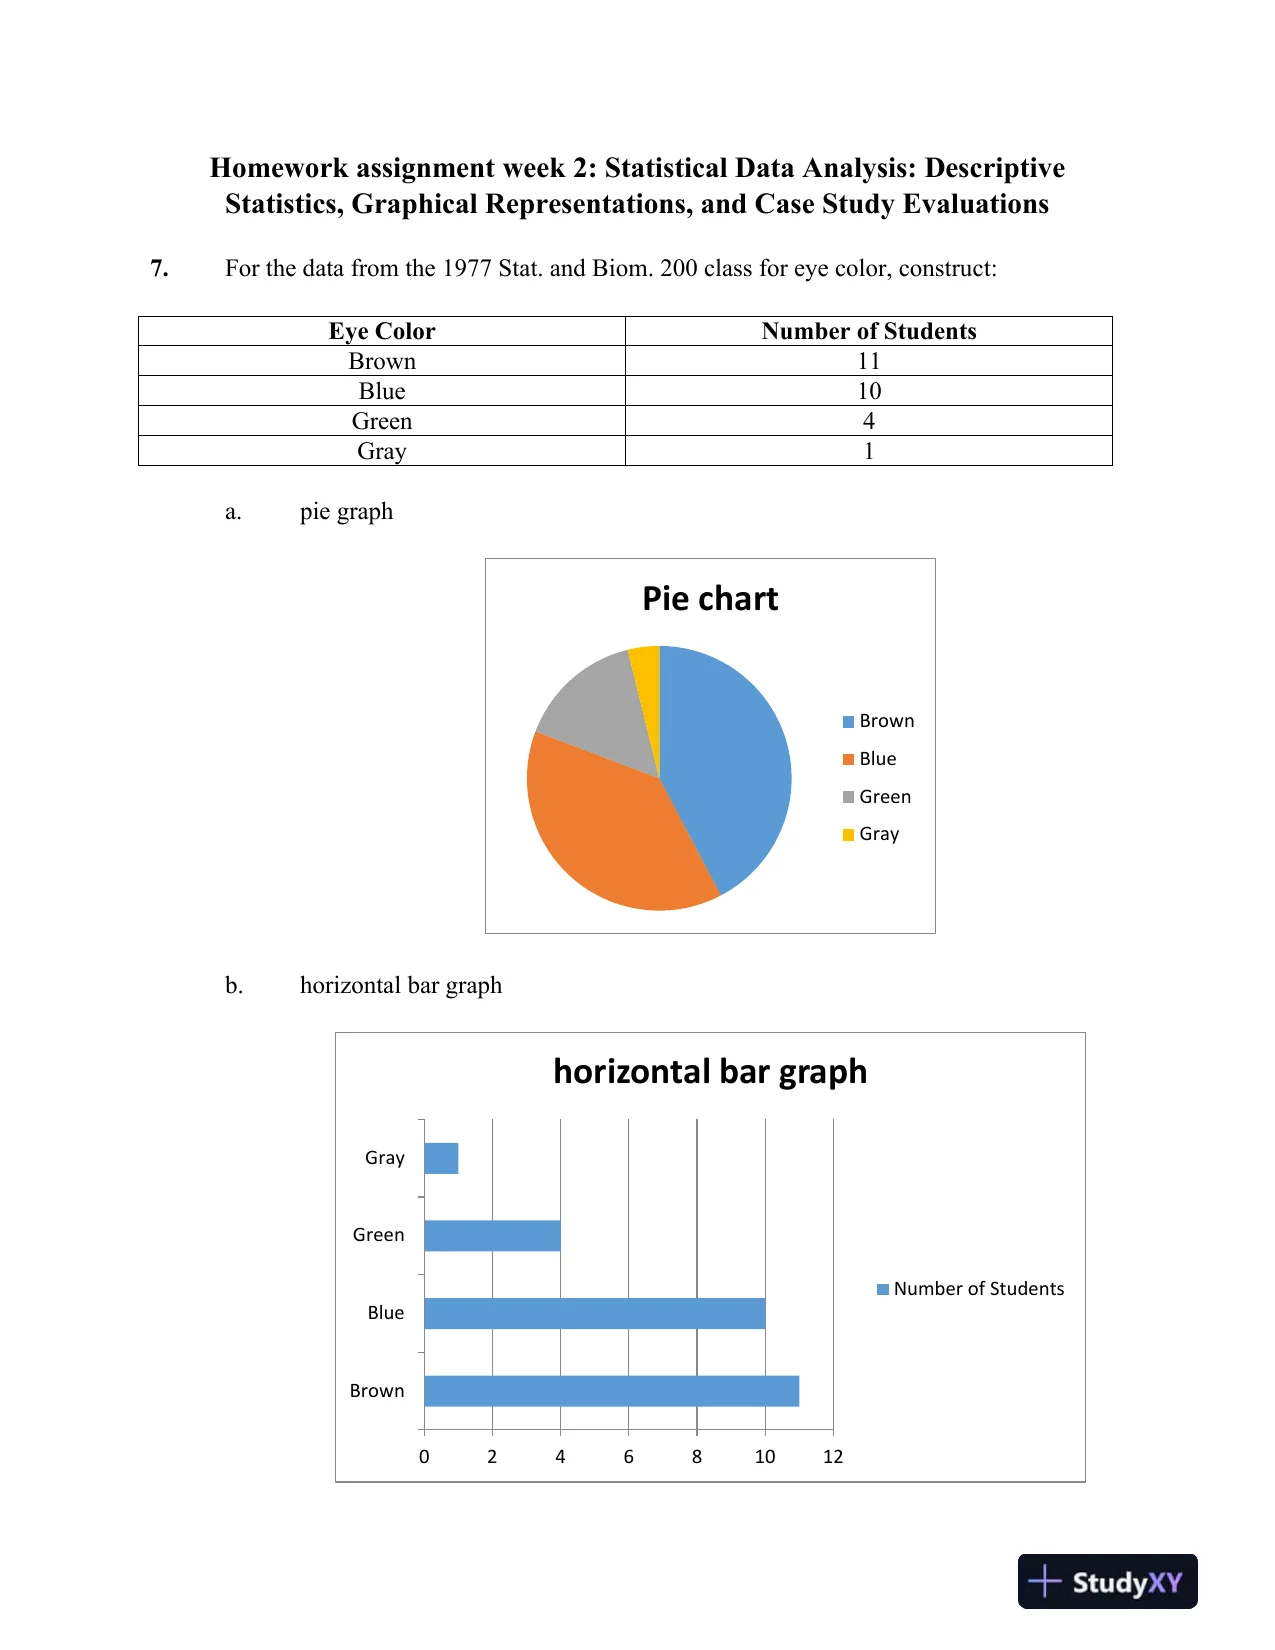
Homework assignment week 2: Statistical Data Analysis: DescriptiveStatistics, Graphical Representations, and Case Study Evaluations7.For the data from the 1977 Stat. and Biom. 200 class for eye color, construct:Eye ColorNumber of StudentsBrown11Blue10Green4Gray1a.pie graphb.horizontal bar graphPie chartBrownBlueGreenGray024681012BrownBlueGreenGrayhorizontal bar graphNumber of Students
Page 2 of 4
Homework assignment Week 2: Statistical Data Analysis: Descriptive Statistics, Graphical Representations, and Case Study Evaluations - Page 2 preview image
Page 3 of 4
Homework assignment Week 2: Statistical Data Analysis: Descriptive Statistics, Graphical Representations, and Case Study Evaluations - Page 3 preview imagec.vertical bar graphd.a frequency table with the relative frequency of each eye colorEyeColorNumber ofStudentsR FiBrown110.423Blue100.385Green40.154Gray10.038261.000024681012BrownBlueGreenGrayvertical bar graphNumber of Students
Page 4 of 4
Homework assignment Week 2: Statistical Data Analysis: Descriptive Statistics, Graphical Representations, and Case Study Evaluations - Page 4 preview image9.Which of the box plots on the graph has a large positive skew?Which has a large negativeskew?The Boxplot is anIndicator of Symmetry. If the line is close to the center ofthe box and the whisker lengths are the same then sample is from a symmetricpopulation. If the top whisker is much longer than the bottom whisker and the lineis gravitating towards the bottom of the box, then sample is from populationwhich is skewed to the right. While, ifthe bottom whisker is much longer than thetop whisker and the line is rising to the top of the box, then sample is frompopulation which is skewed to the left.Here,Box plotB.has alargepositive skew.And,Box plotC.has alargenegative skew.6.You recorded thetime in seconds it took for 8 participants to solve a puzzle. These timesappear below. However, when the data was entered into the statistical program, the scorethat was supposed to be 22.1 was entered as 21.2.You had calculated the following measures of central tendency:the mean, the median,and the mean trimmed 25%.Which of these measures of central tendency will changewhen you correct the recording error?
Preview Mode

This document has 12 pages. Sign in to access the full document!