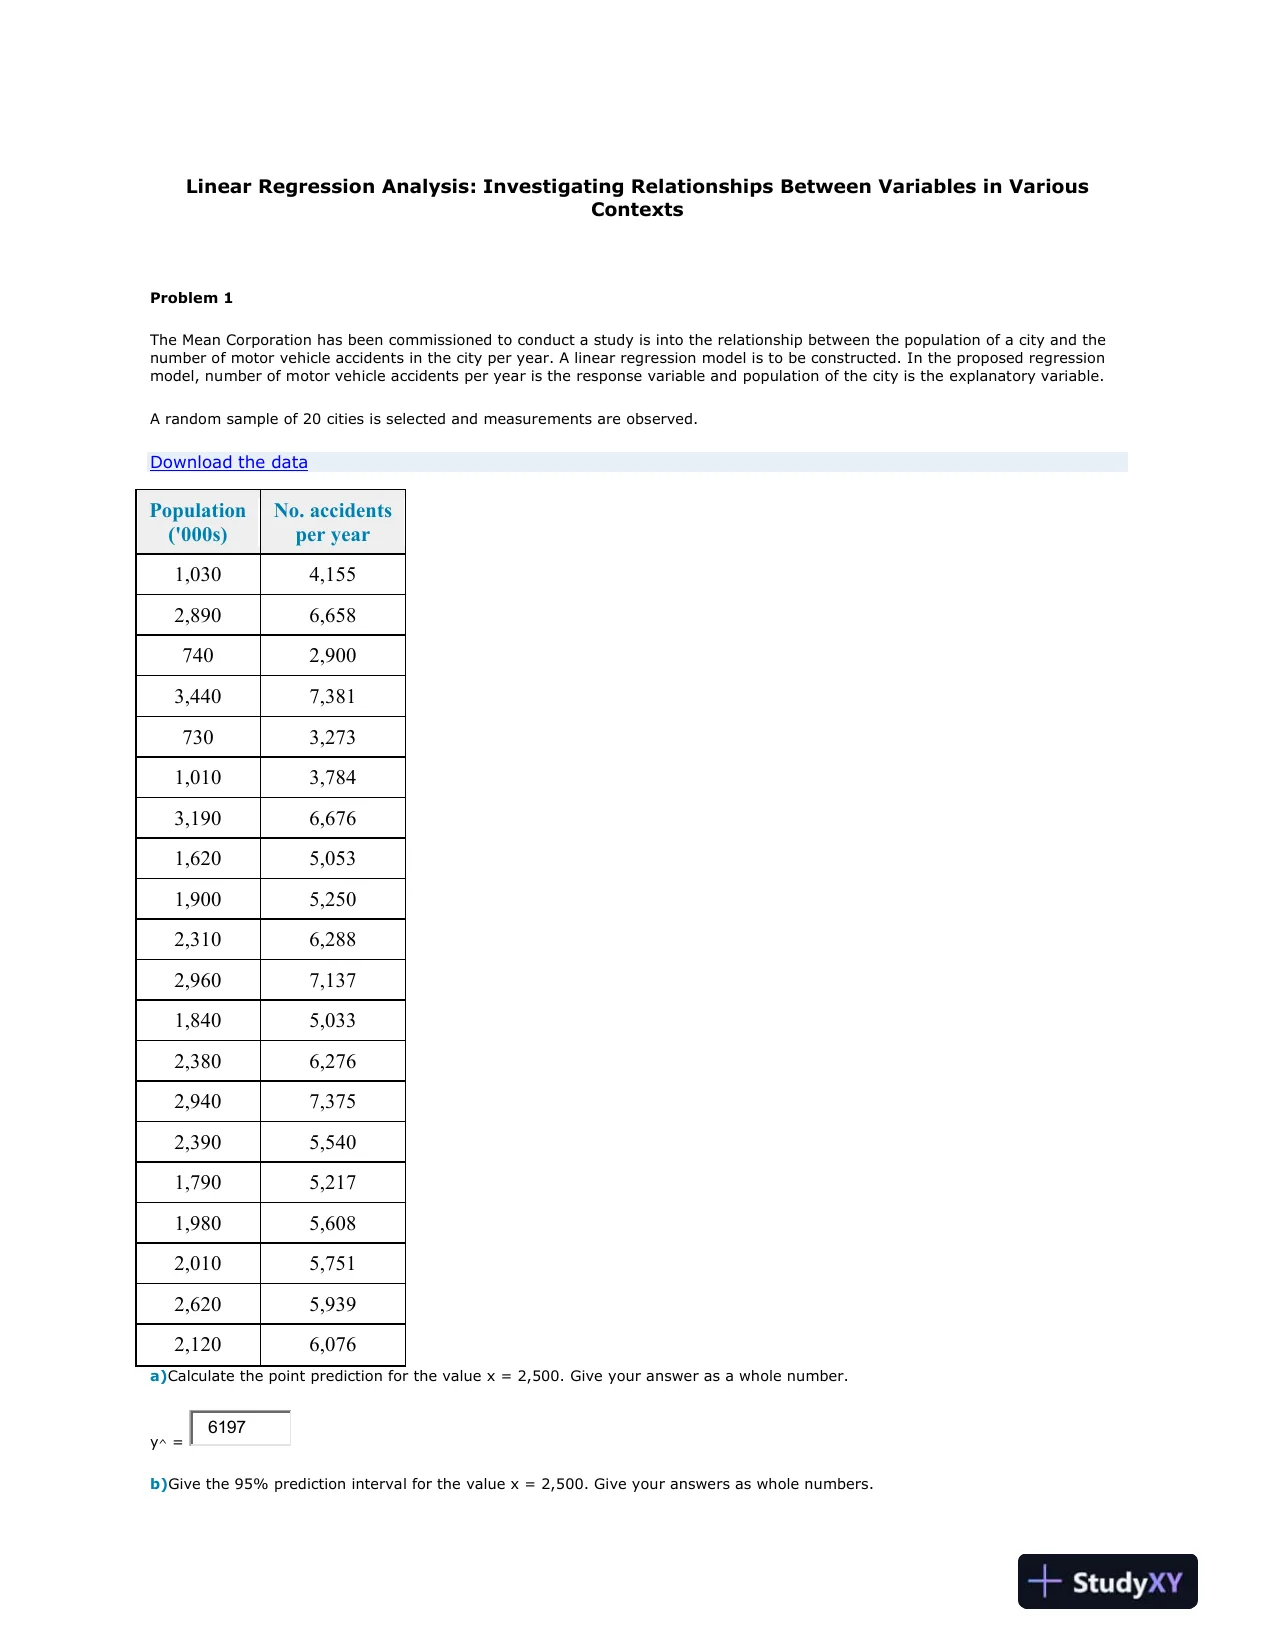
 Linear Regression Analysis: Investigating Relationships Between Variables in VariousContextsProblem 1The Mean Corporation has been commissioned to conduct a study is into the relationship between the population of a city and thenumber of motorvehicle accidents in the city per year. A linear regression model is to be constructed. In the proposed regressionmodel, number of motor vehicle accidents per year is the response variable and population of the city is the explanatory variable.A random sample of 20 cities is selected and measurements are observed.Download the dataPopulation('000s)No. accidentsper year1,0304,1552,8906,6587402,9003,4407,3817303,2731,0103,7843,1906,6761,6205,0531,9005,2502,3106,2882,9607,1371,8405,0332,3806,2762,9407,3752,3905,5401,7905,2171,9805,6082,0105,7512,6205,9392,1206,076a)Calculate the point prediction for the valuex = 2,500. Give your answer as a whole number.y^=6197b)Give the 95% prediction interval for the valuex = 2,500. Give your answers as whole numbers.
Preview Mode
This document has 12 pages. Sign in to access the full document!